Real-time Widget
The Real-time widget shows recent activity for a selected record type and source. It can calculate recent values as a sum, count, or average over a selected time span.
Inputs and Controls
| Control | Description |
|---|---|
| Chart type | Vertical bar, horizontal bar, line, or filled line chart. |
| Time span | Show the latest 5 minutes, 30 minutes, 1, 2, 4, 8, 16, or 24 hours. |
| Metric | Aggregate activity by sum, count, or average. |
| Record type | Select the record type used as the real-time data source. |
| Record source | Optionally limit the widget to one source. |
| Custom title | Add a title shown above the widget. |
Tips and good uses
Tips
- Use short time spans for operational views.
- Choose record types that arrive frequently enough to be meaningful.
- Pair it with Data Value widgets for summary KPIs.
Good uses
- Recent leads or conversions
- Last 30 minutes or 24 hours of activity
- Short-term campaign monitoring
- Operational dashboards
Configuration and Usage
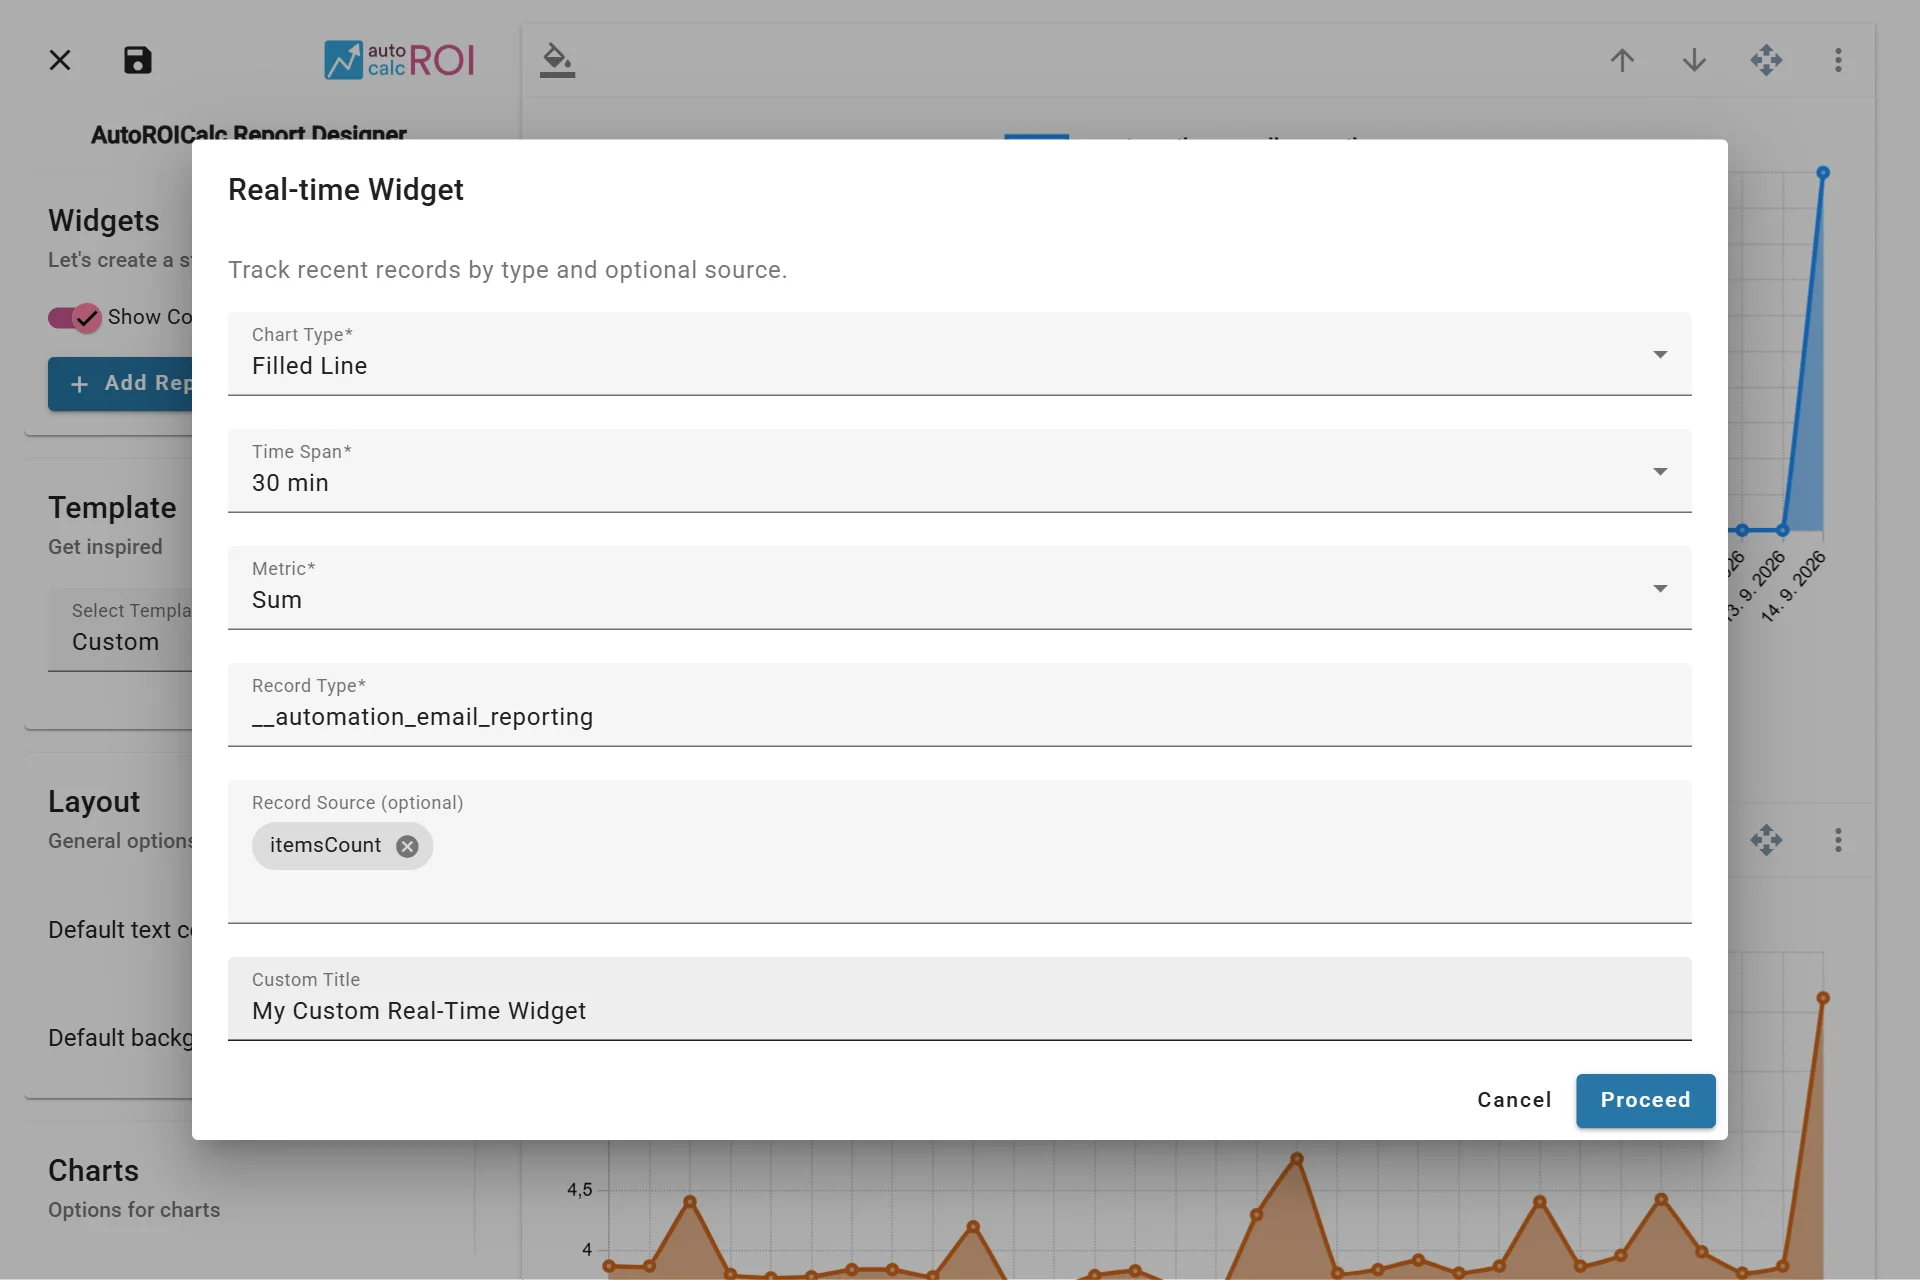
Configuring the Real-time Widget
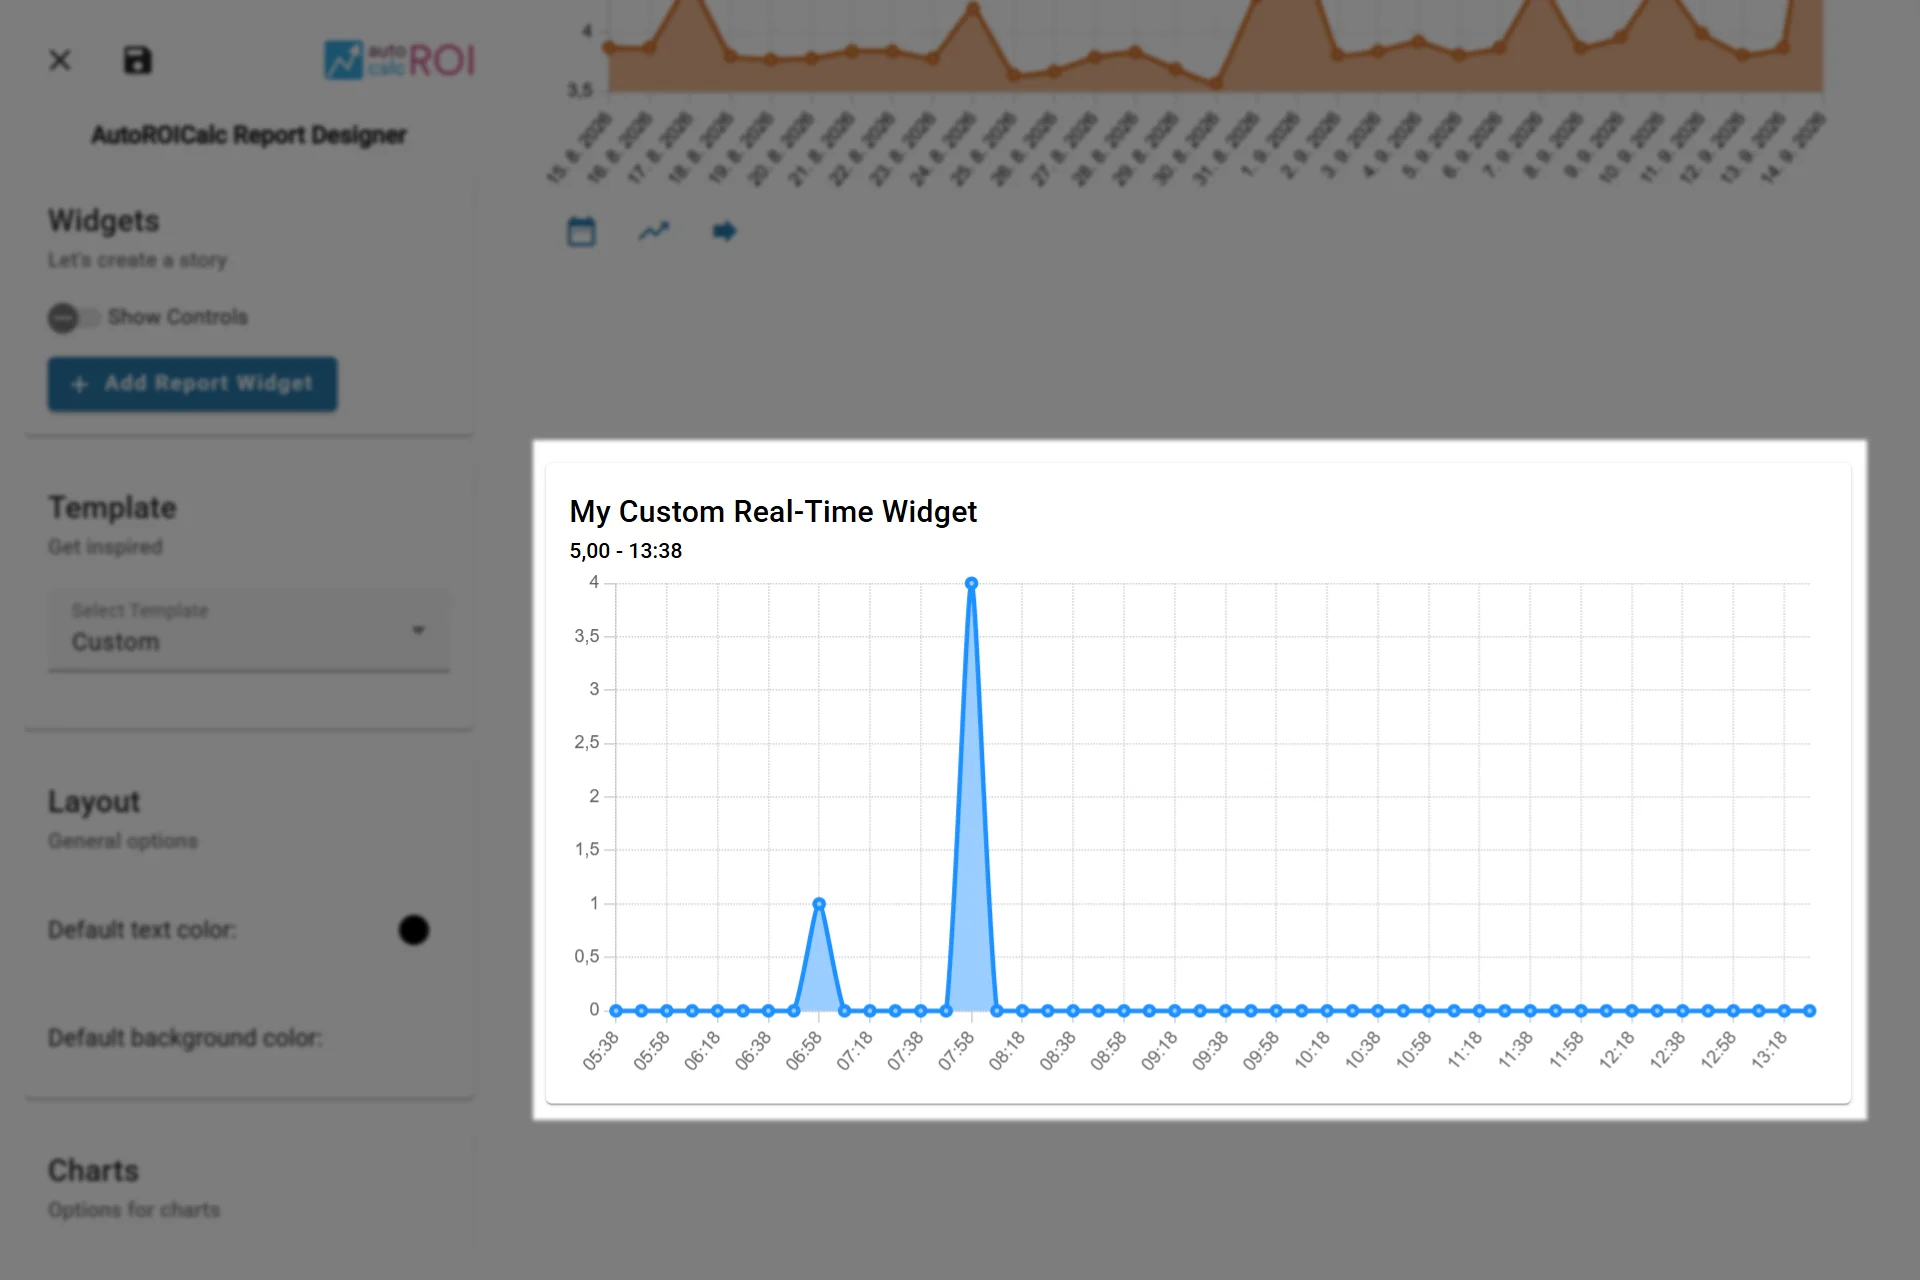
A sample usage of the Real-time Widget