Report Layout and Widgets
Report layout controls how report results are presented. You can use the default report layout or enable the advanced layout designer for a more customized report view.
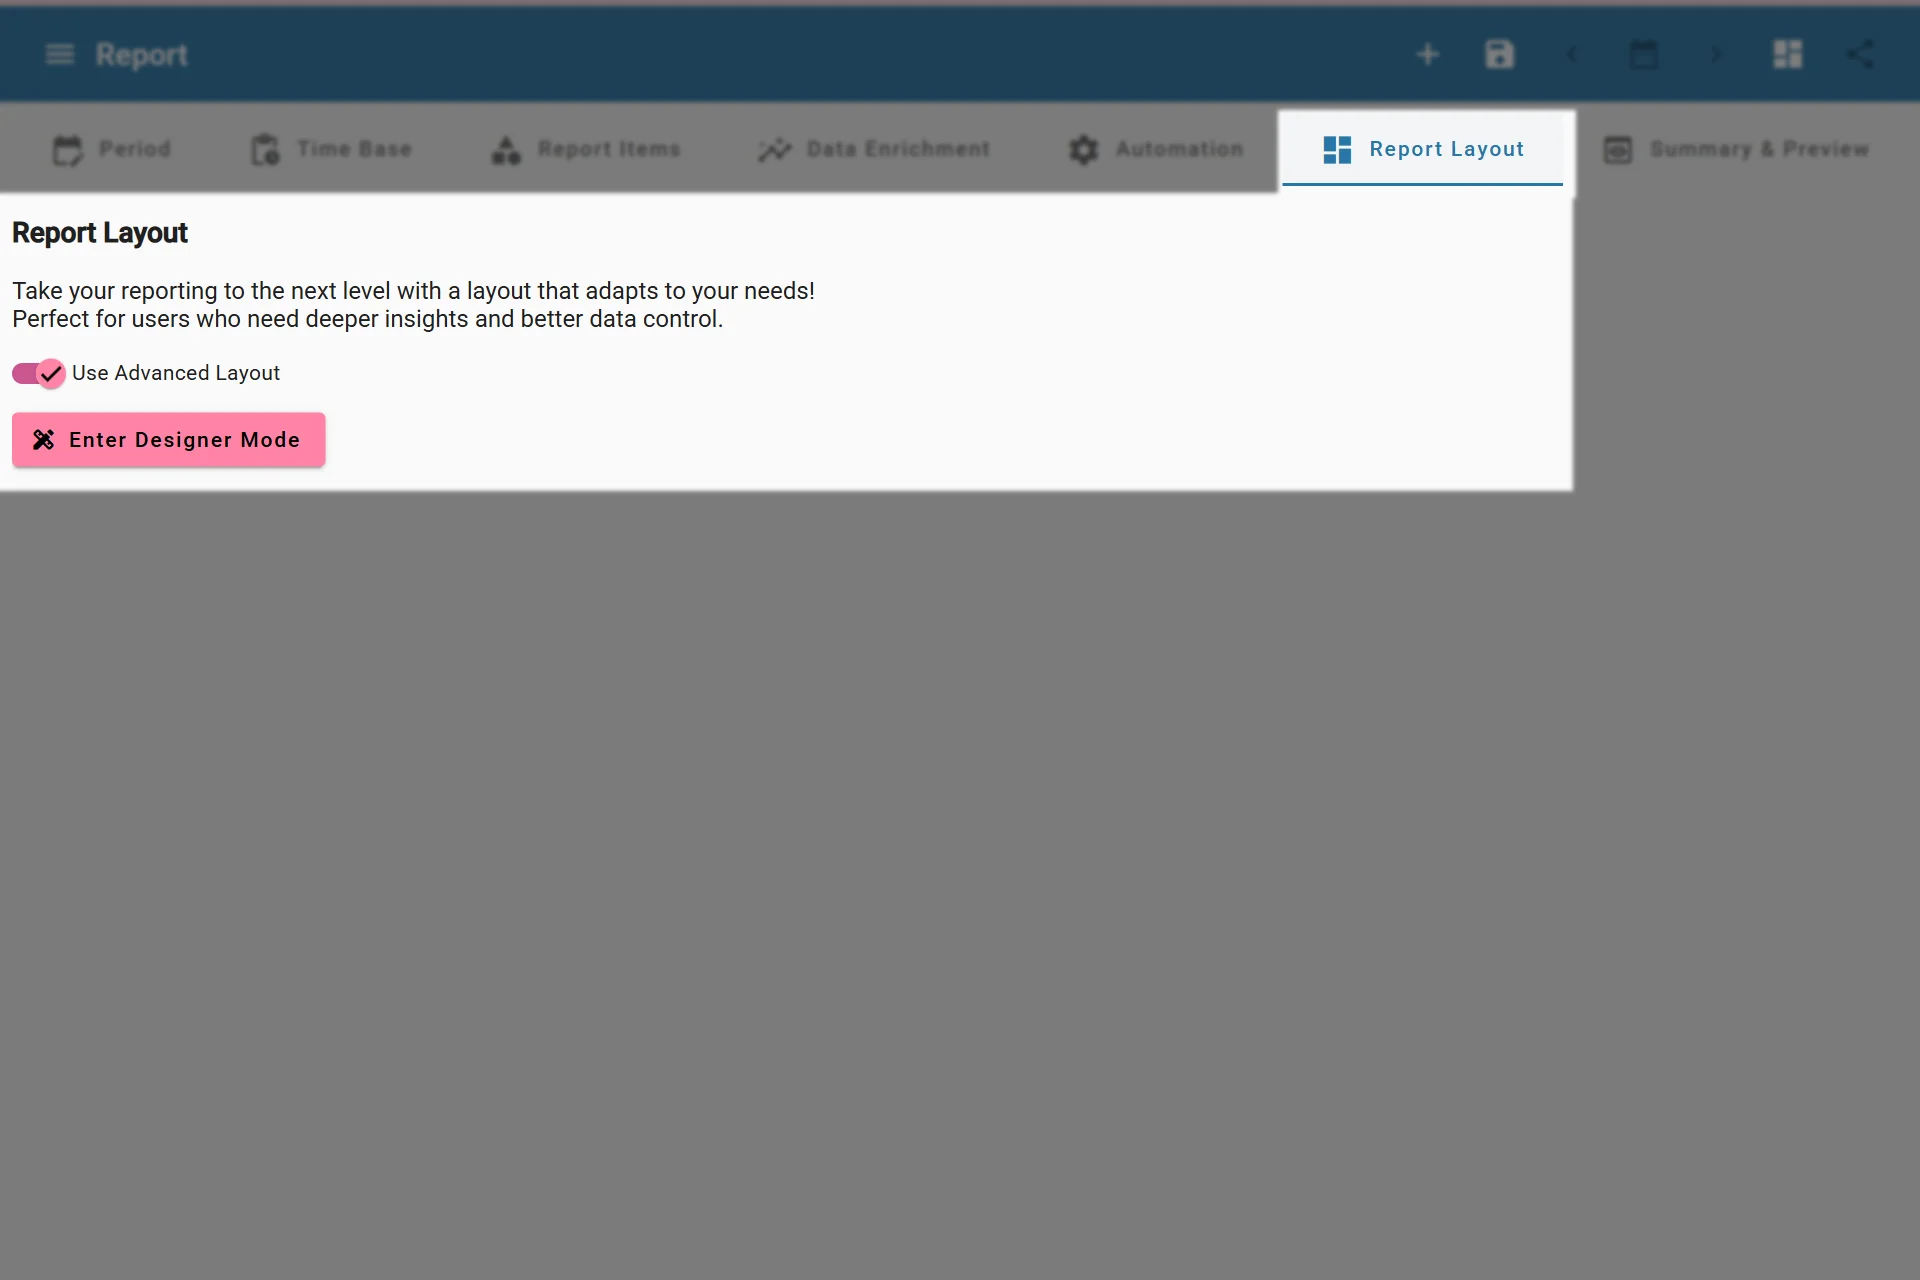
Setting Report Layout to Advanced
Default Layout
The default layout is useful when you want a quick report with standard charts, values, tables, and summaries. It works well for most simple reports and is the best starting point while you are validating report data.
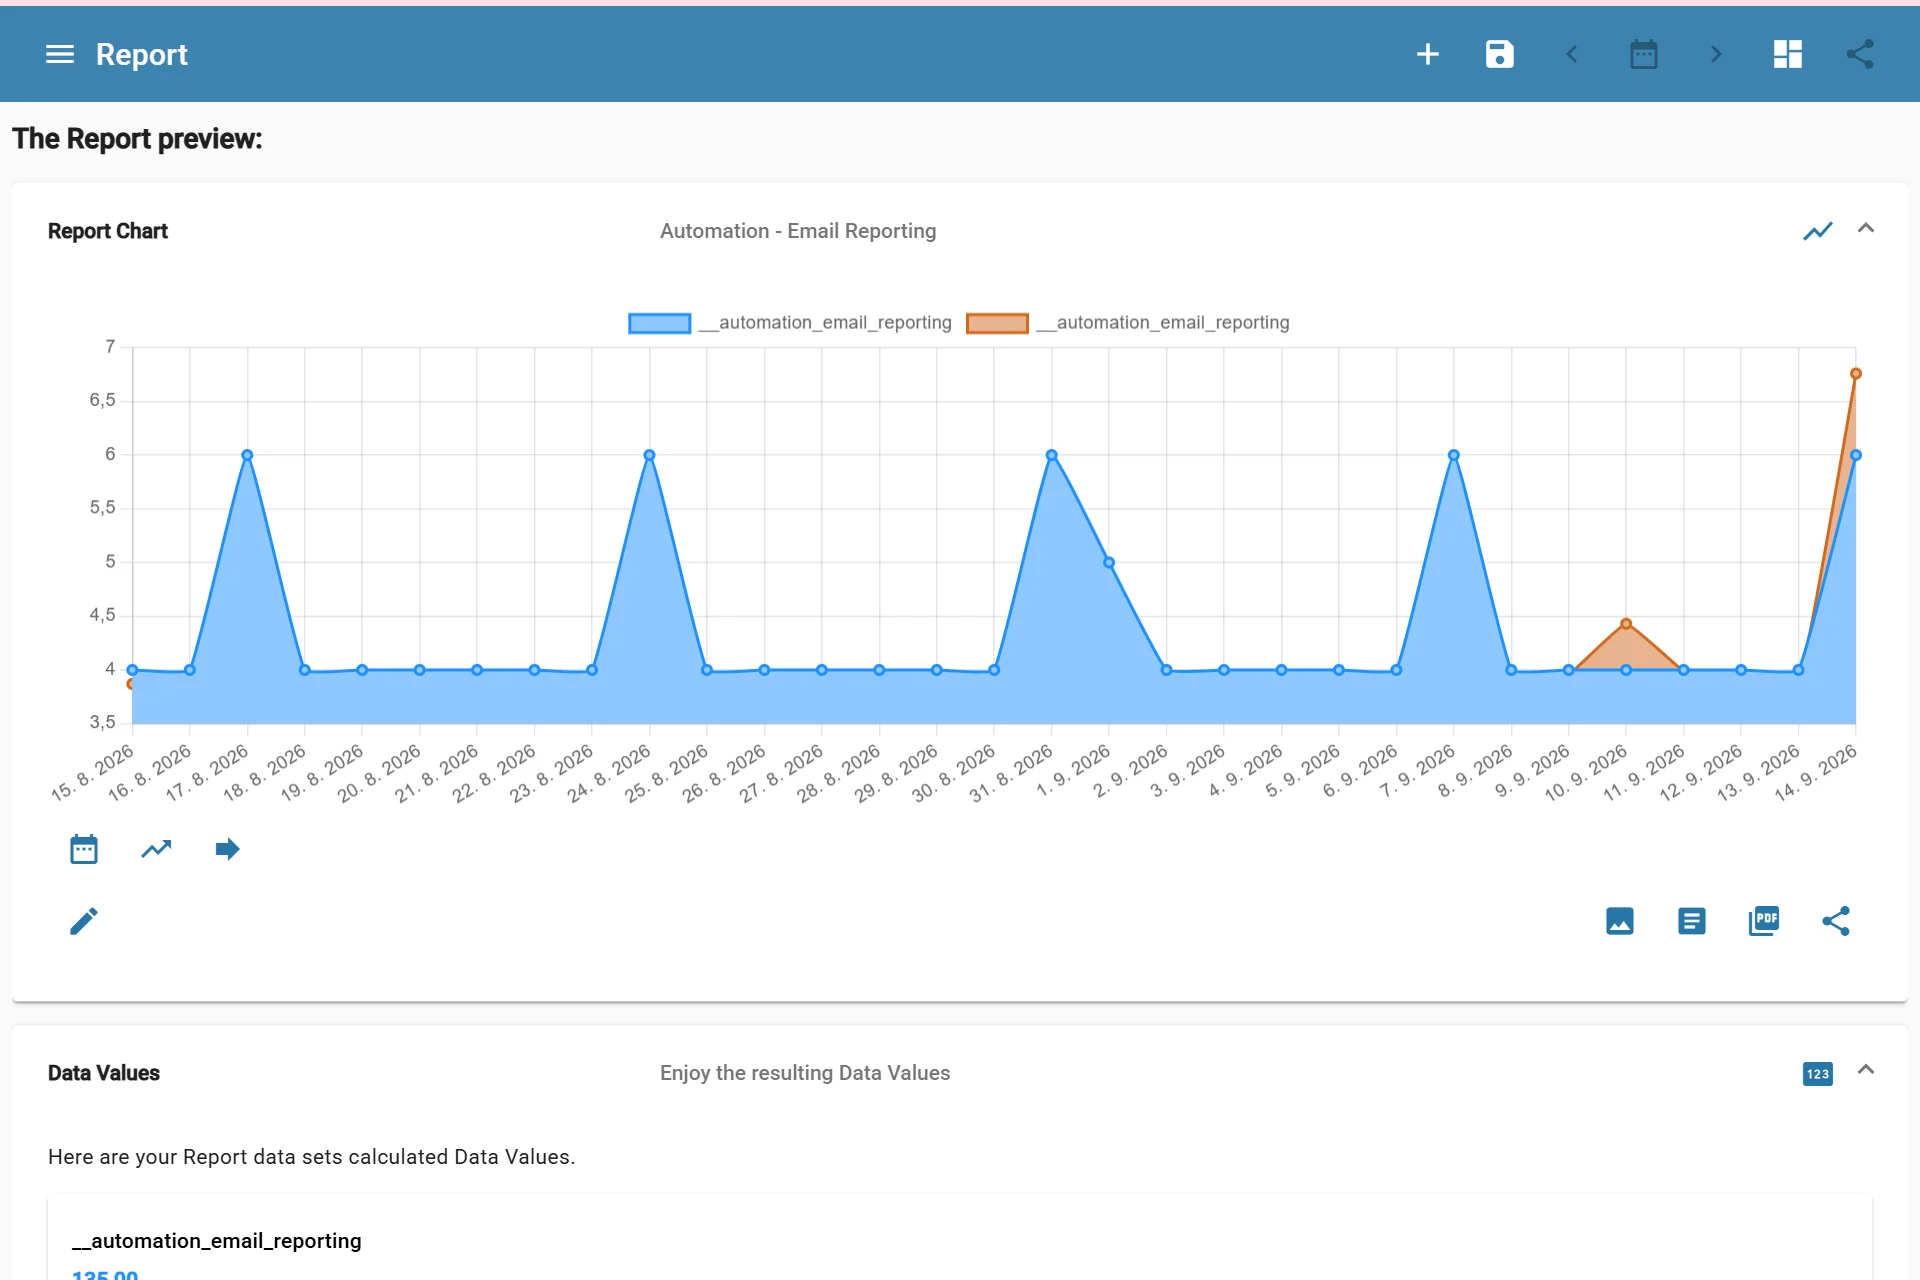
Previewing the Default Report Layout
Advanced Layout Designer
The advanced layout designer lets you build a custom report screen with draggable widgets. It is useful when a report needs a dashboard-like layout, client-facing presentation, or a more detailed analytical view.
Advanced layout options include:
- Layout templates
- Text and background colors
- Chart grid color
- Legend and scale font settings
- Grid line style and thickness
- Widget placement, resizing, cloning, and removal
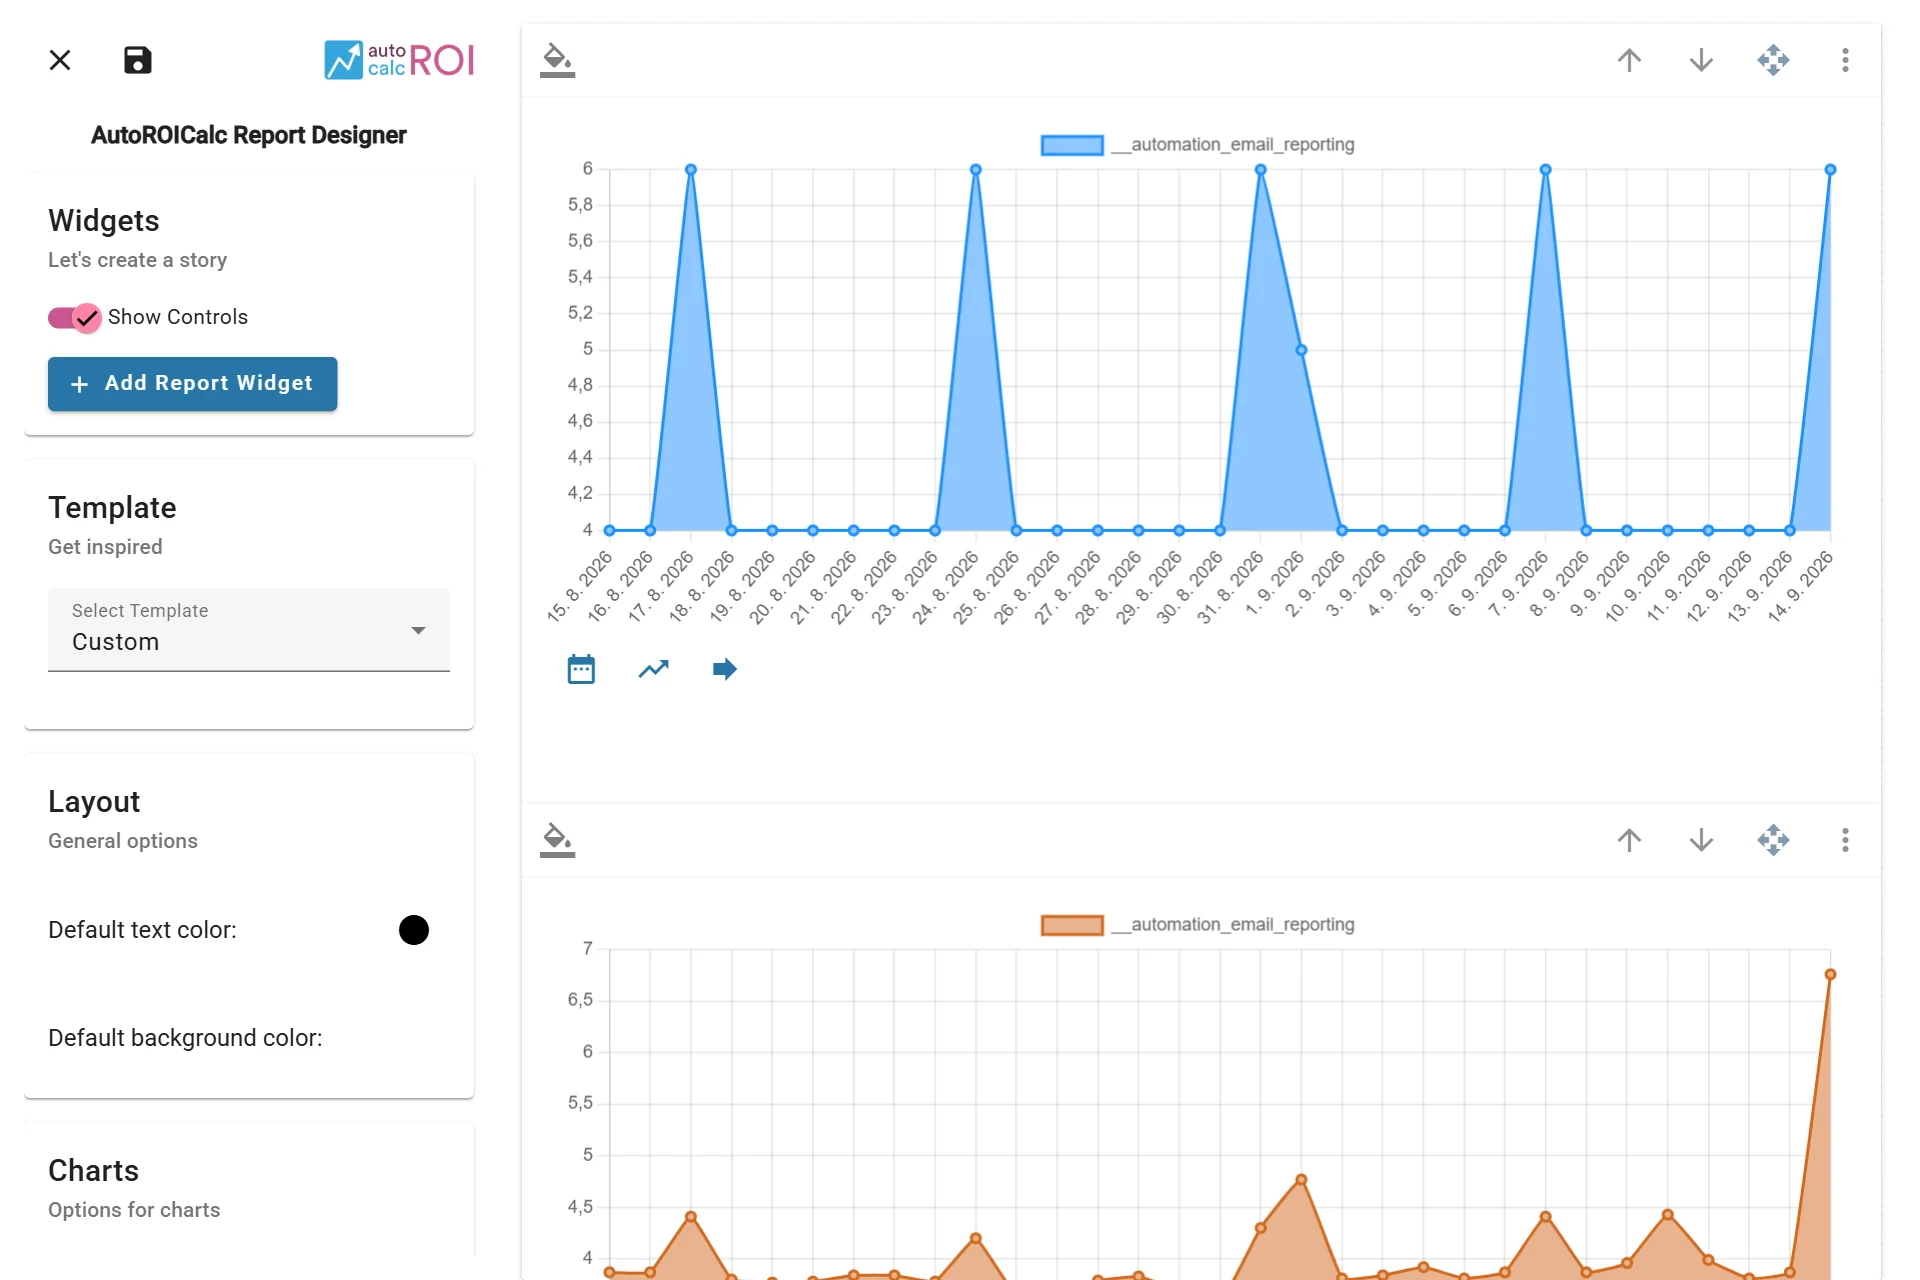
Previewing the Report Advanced Layout in the Report Designer
Layout Templates
The report designer includes templates such as:
- Custom
- Light Minimal
- Dark Pro
- Corporate Blue
- Earthy Neutral
- High Contrast
- Neo Tech
Templates are a starting point. You can adjust widgets and styles after applying a template.
Available Widgets
Advanced layouts can include several widget types:
| Widget | Group | Use for |
|---|---|---|
| Section | Content | Text headings, notes, and section content inside the report |
| Image | Content | Logos, screenshots, campaign creatives, or other supporting visuals |
| Date Range | Content | Showing the report period inside the advanced layout |
| Chart | Charts and Visuals | Time-based report item charts and trend comparisons |
| Real-time | Charts and Visuals | Recent activity views for selected record types and sources |
| Gauge | Charts and Visuals | Gauge-style KPI and progress displays |
| Target | Charts and Visuals | Comparing a selected metric against a target |
| Map | Charts and Visuals | Geographic report visualization |
| Data Table | Tables and Values | Detailed report values in a table |
| Data Value | Tables and Values | A focused single KPI or headline value |
| Sources Distribution | Breakdowns | Contribution by record source |
| Conversion Paths | Breakdowns | Source path and touchpoint analysis |
| Breakdown | Breakdowns | Custom data breakdowns from records |
| Contribution Mix | Breakdowns | Mixed contribution comparison, such as pie or donut views |
| Mix | Breakdowns | Compact combined source or value comparisons |
For a grouped widget overview and guidance on choosing widgets, see the widget reference:
When to Use Advanced Layouts
Use advanced layouts when:
- The report will be reviewed often
- A client or team needs a polished view
- Several report widgets should be shown together
- You want to highlight targets, breakdowns, maps, or key values
- The default layout is too linear for the story you want to tell