Dashboards Overview
AutoROICalc dashboards combine saved reports into one reusable business view. They are useful for monitoring ROI, marketing performance, ecommerce activity, client results, or operational KPIs without opening each report separately.
A dashboard does not replace reports. Instead, it organizes the reports you already created and displays them together in a single dashboard page.
Build reports first
Create and test the reports you want to monitor before adding them to a dashboard. A dashboard works best when each report already answers one clear business question.
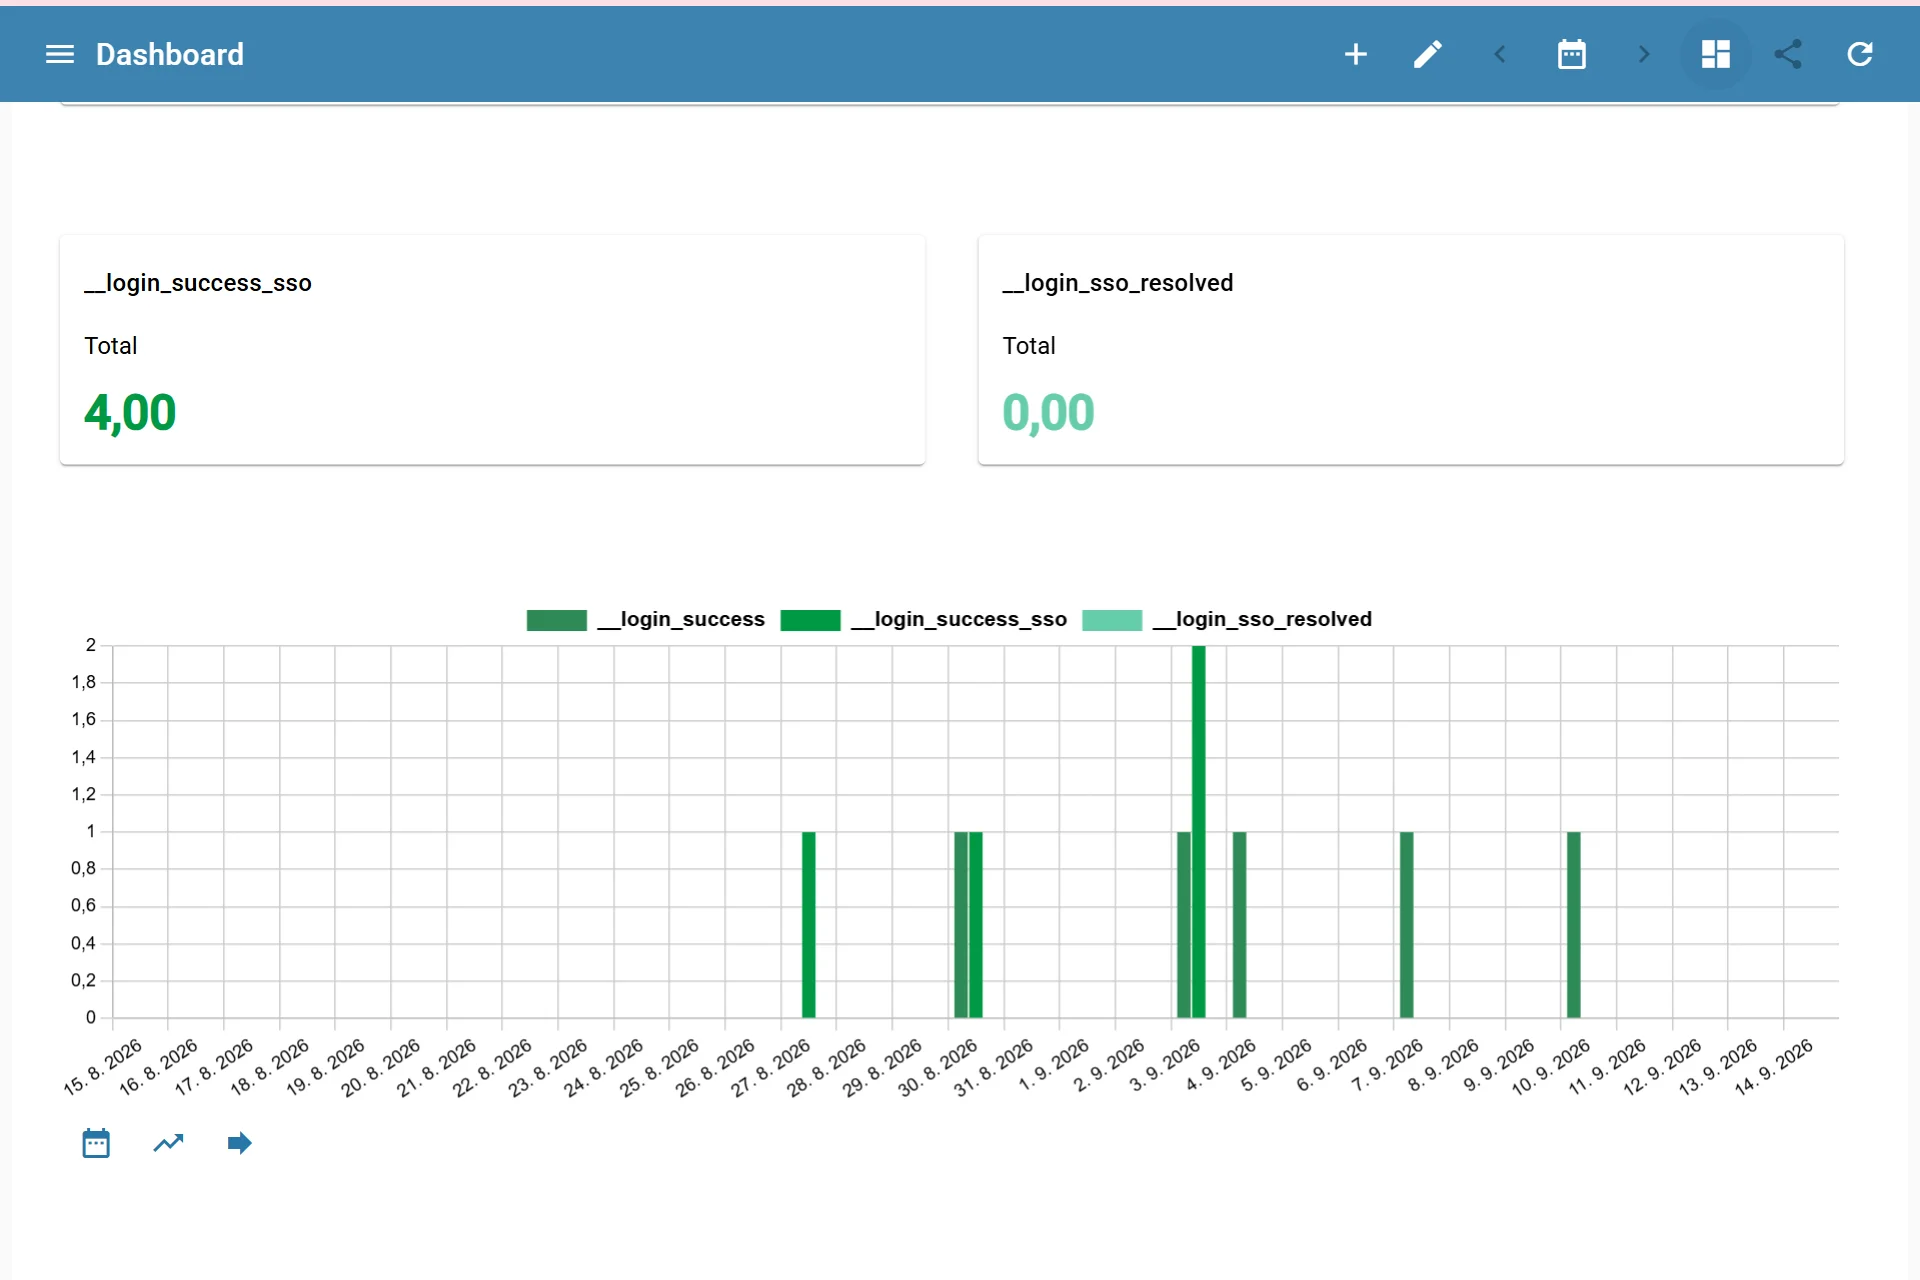
Viewing a Dashboard
What a Dashboard Contains
A dashboard configuration usually includes:
| Area | Purpose |
|---|---|
| Dashboard name | Identifies the dashboard in the dashboard list |
| Description | Explains what the dashboard is used for |
| Tags | Helps filter and organize dashboards |
| Reports | Defines which saved reports are displayed on the dashboard |
| Report order | Controls the order in which reports appear |
| Email reporting | Optionally sends the dashboard by email on a schedule |
A dashboard stores references to saved reports. Each selected report keeps its own report configuration, including period, time base, report items, enrichment, automation rules, and layout. Updating a report can change how it appears in dashboards, while removing a report from a dashboard does not delete the report itself.
Dashboard Workflow
-
Create a Dashboard
Select saved reports, add a clear name, organize the report order, and save the dashboard for later use.
-
Managing Dashboards
Search dashboards by name, filter by tags, open dashboards, edit existing dashboards, clone useful setups, or delete old views.
-
Email Reporting
Configure scheduled dashboard emails for recurring reporting, stakeholder updates, or client delivery.
Choosing Reports for a Dashboard
Choose reports that belong together and answer related questions. For example, a marketing dashboard could include:
- Advertising costs by source
- Leads or conversions by campaign
- Revenue by channel
- ROI or cost per conversion
For a client dashboard, use reports that match the client reporting promise and avoid adding internal-only metrics unless they are needed.
Create a separate dashboard when the audience, reporting period, or business goal changes. For example, a weekly management dashboard and a monthly client dashboard may use some of the same reports but need different organization.
Common Dashboard Use Cases
- Marketing ROI overview
- Weekly client reporting
- Ecommerce sales and cost monitoring
- Paid ads performance dashboard
- Lead generation and conversion tracking
- Internal management reporting