Quick Start
This guide walks you through the shortest path from an empty AutoROICalc account to a basic dashboard.
Shared property permissions
If you joined a shared property, select it from Account or the sidenav account menu before following this guide. Readers and editors can use its existing data; adding or importing records and completing property setup require an admin or owner. Connected integration setup requires the owner. See Shared Properties.
Before You Start
You need:
- Access to AutoROICalc
- A business activity you want to measure
- A few sample records, or a CSV/XML/ARC file to import
Use sample or demo data first
If you are evaluating the platform, start with a small set of sample records. You can delete the sample records or refine record types, sources, and report structure after the first report works.
Need some sample records?
We've prepared CSV, XML, and ARC files with dummy records you can use while getting started with the app.
1. Create an AutoROICalc Account
Go to the app and create your account:
- Register with a username, e-mail, and password
- Or continue with Google or Facebook
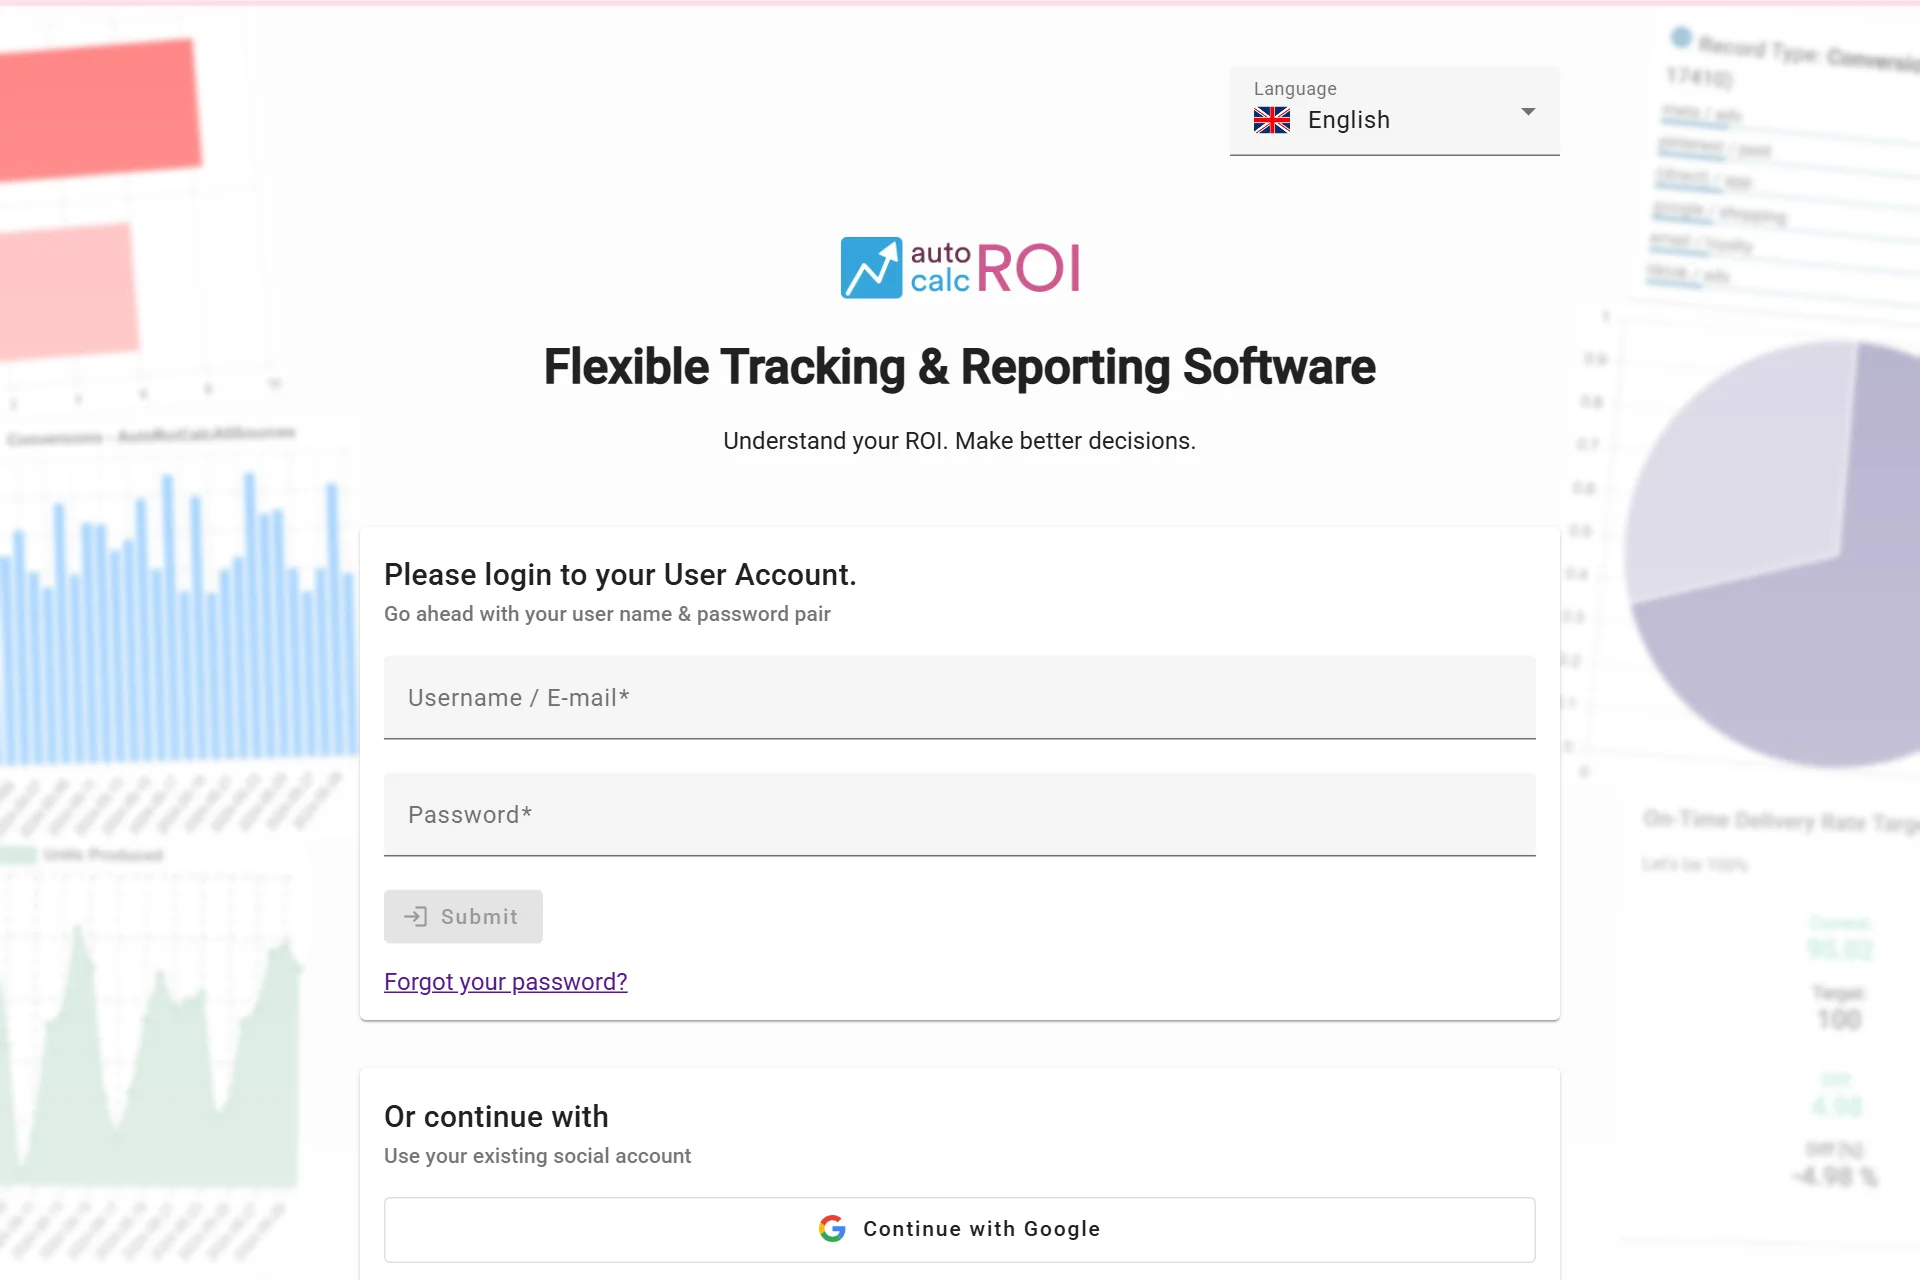
AutoROICalc account creation screen
2. Confirm Important App Settings
Take a minute to confirm the basic settings for your account:
- Language
- Time zone
- Number format
- Whether to import demo data
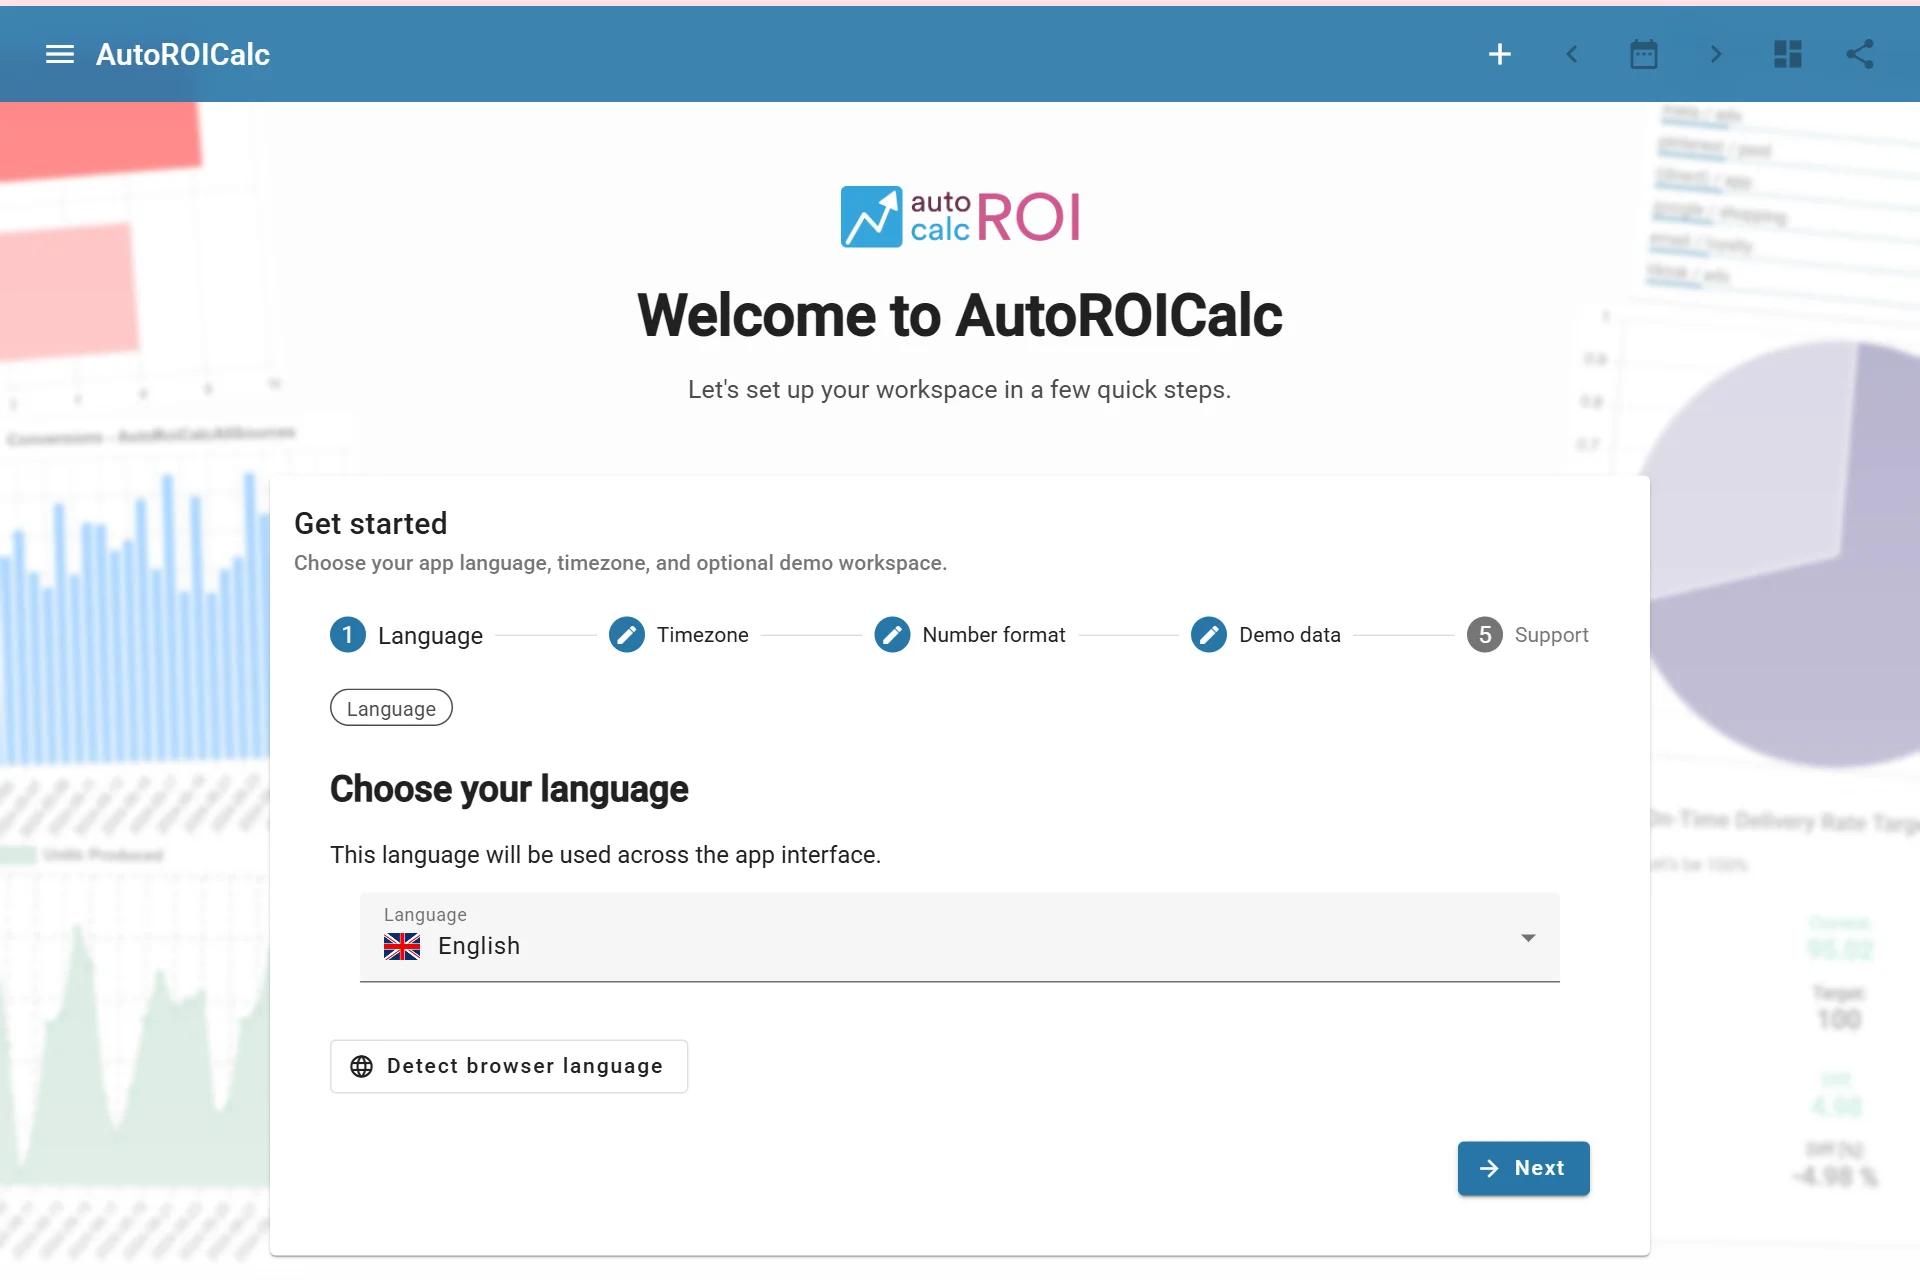
AutoROICalc onboarding screen
2.1 Demo data
The demo data includes sample records and a sample report that showcase the app features.
Currently available demo data:
- Marketing & Agencies
- Ecommerce & Retail
- SaaS & Tech
- Finance & Investment
- Manufacturing & Logistics
- Franchises & Multi-Location
Pick demo data or use your own records?
Pick the demo data first if you want a quick showcase. Use your own records if you want to become familiar with the app using real inputs.
3. Create or Import Records
Did you import the demo data?
If you imported the demo data, you can skip this section.
Records are the source data for reports. Start by adding a few records manually or importing an existing file.
3.1 Add records manually
Open the app sidebar and go to Records -> Add a Record. Adding 2-3 sample records with different dates is enough for the quick start.
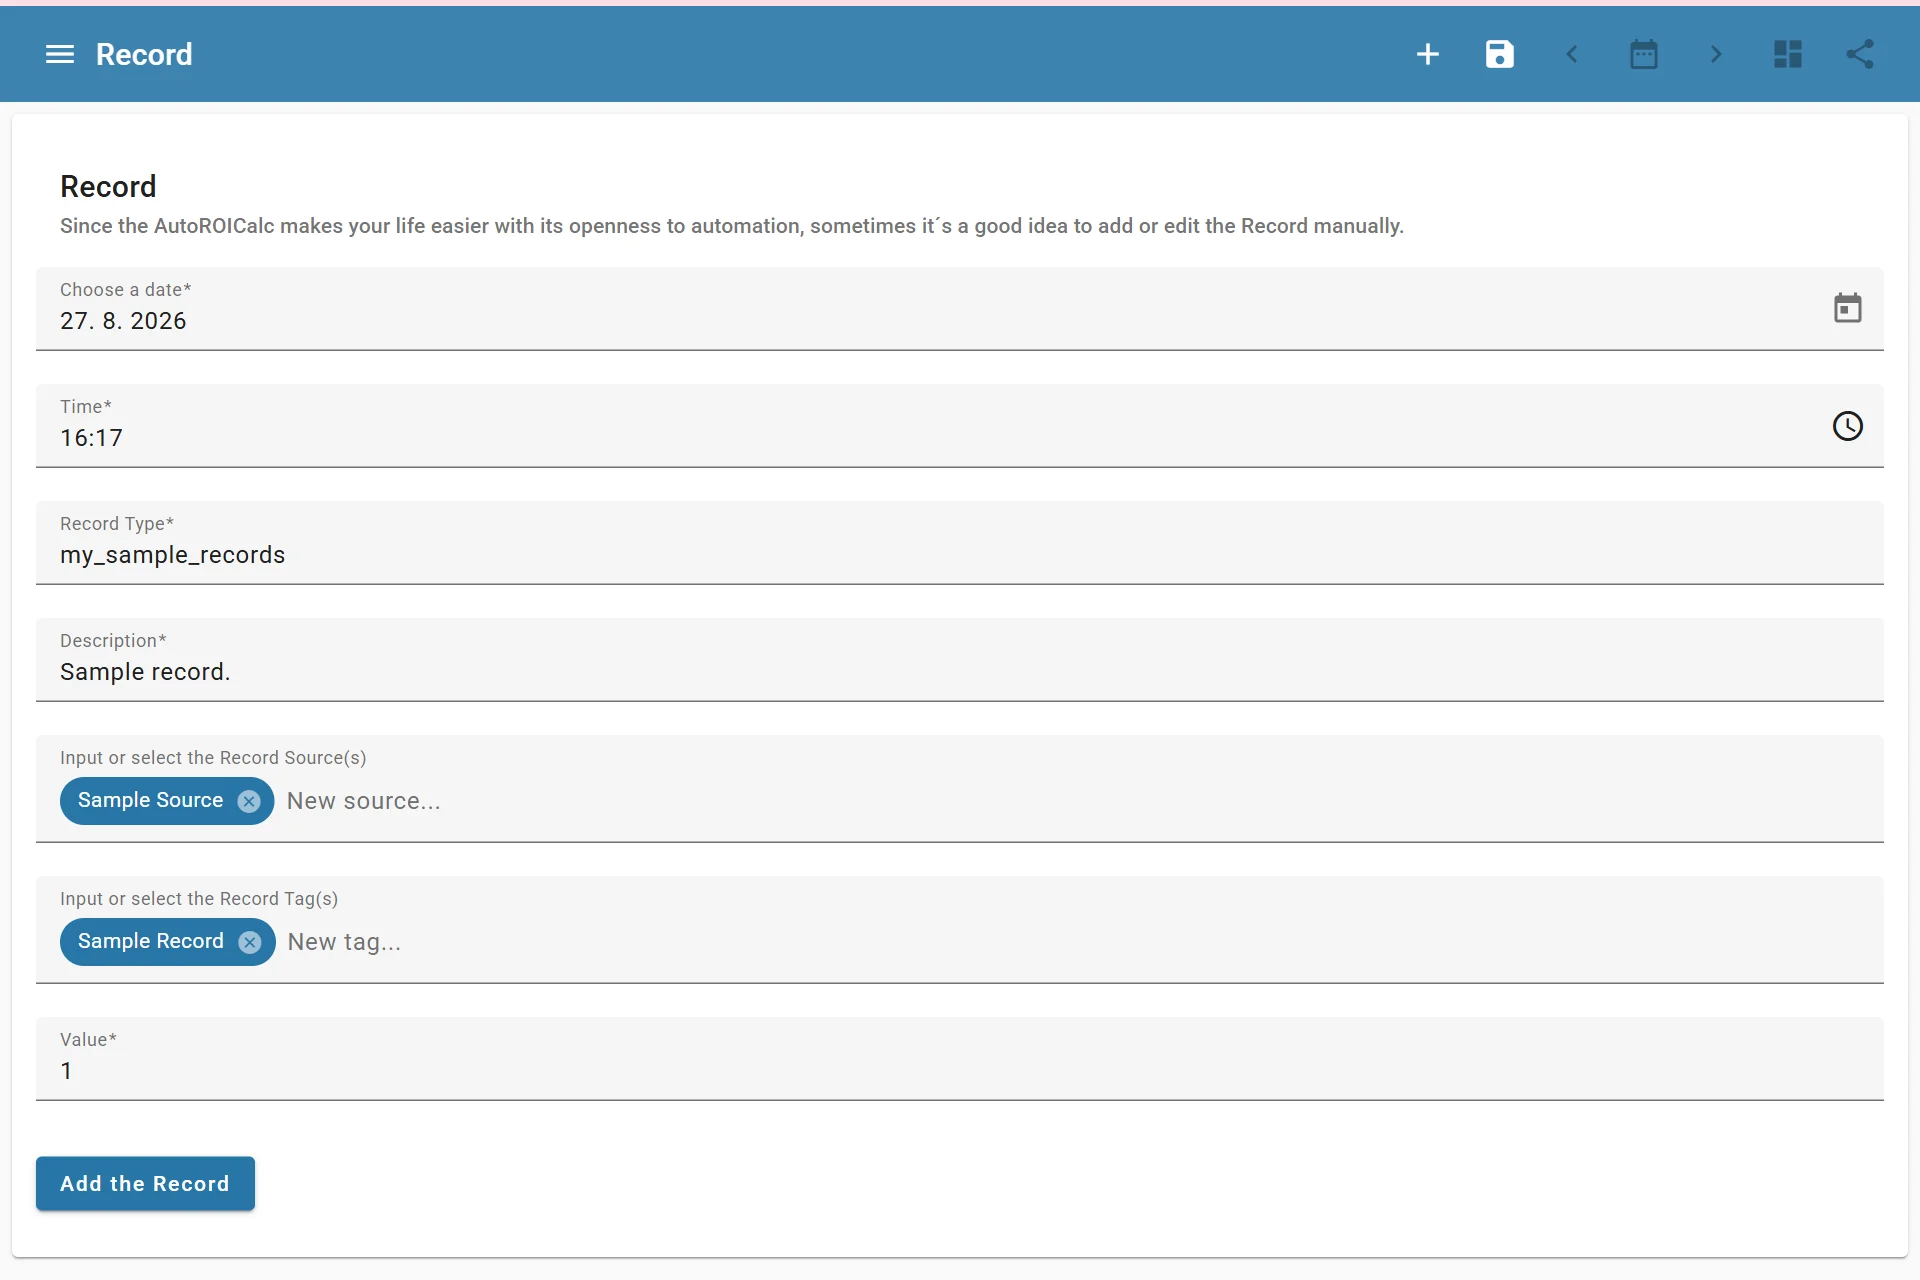
Adding a sample record
3.2 Import records
As a shortcut, you can import the sample records from above. In the app, select the matching import option:
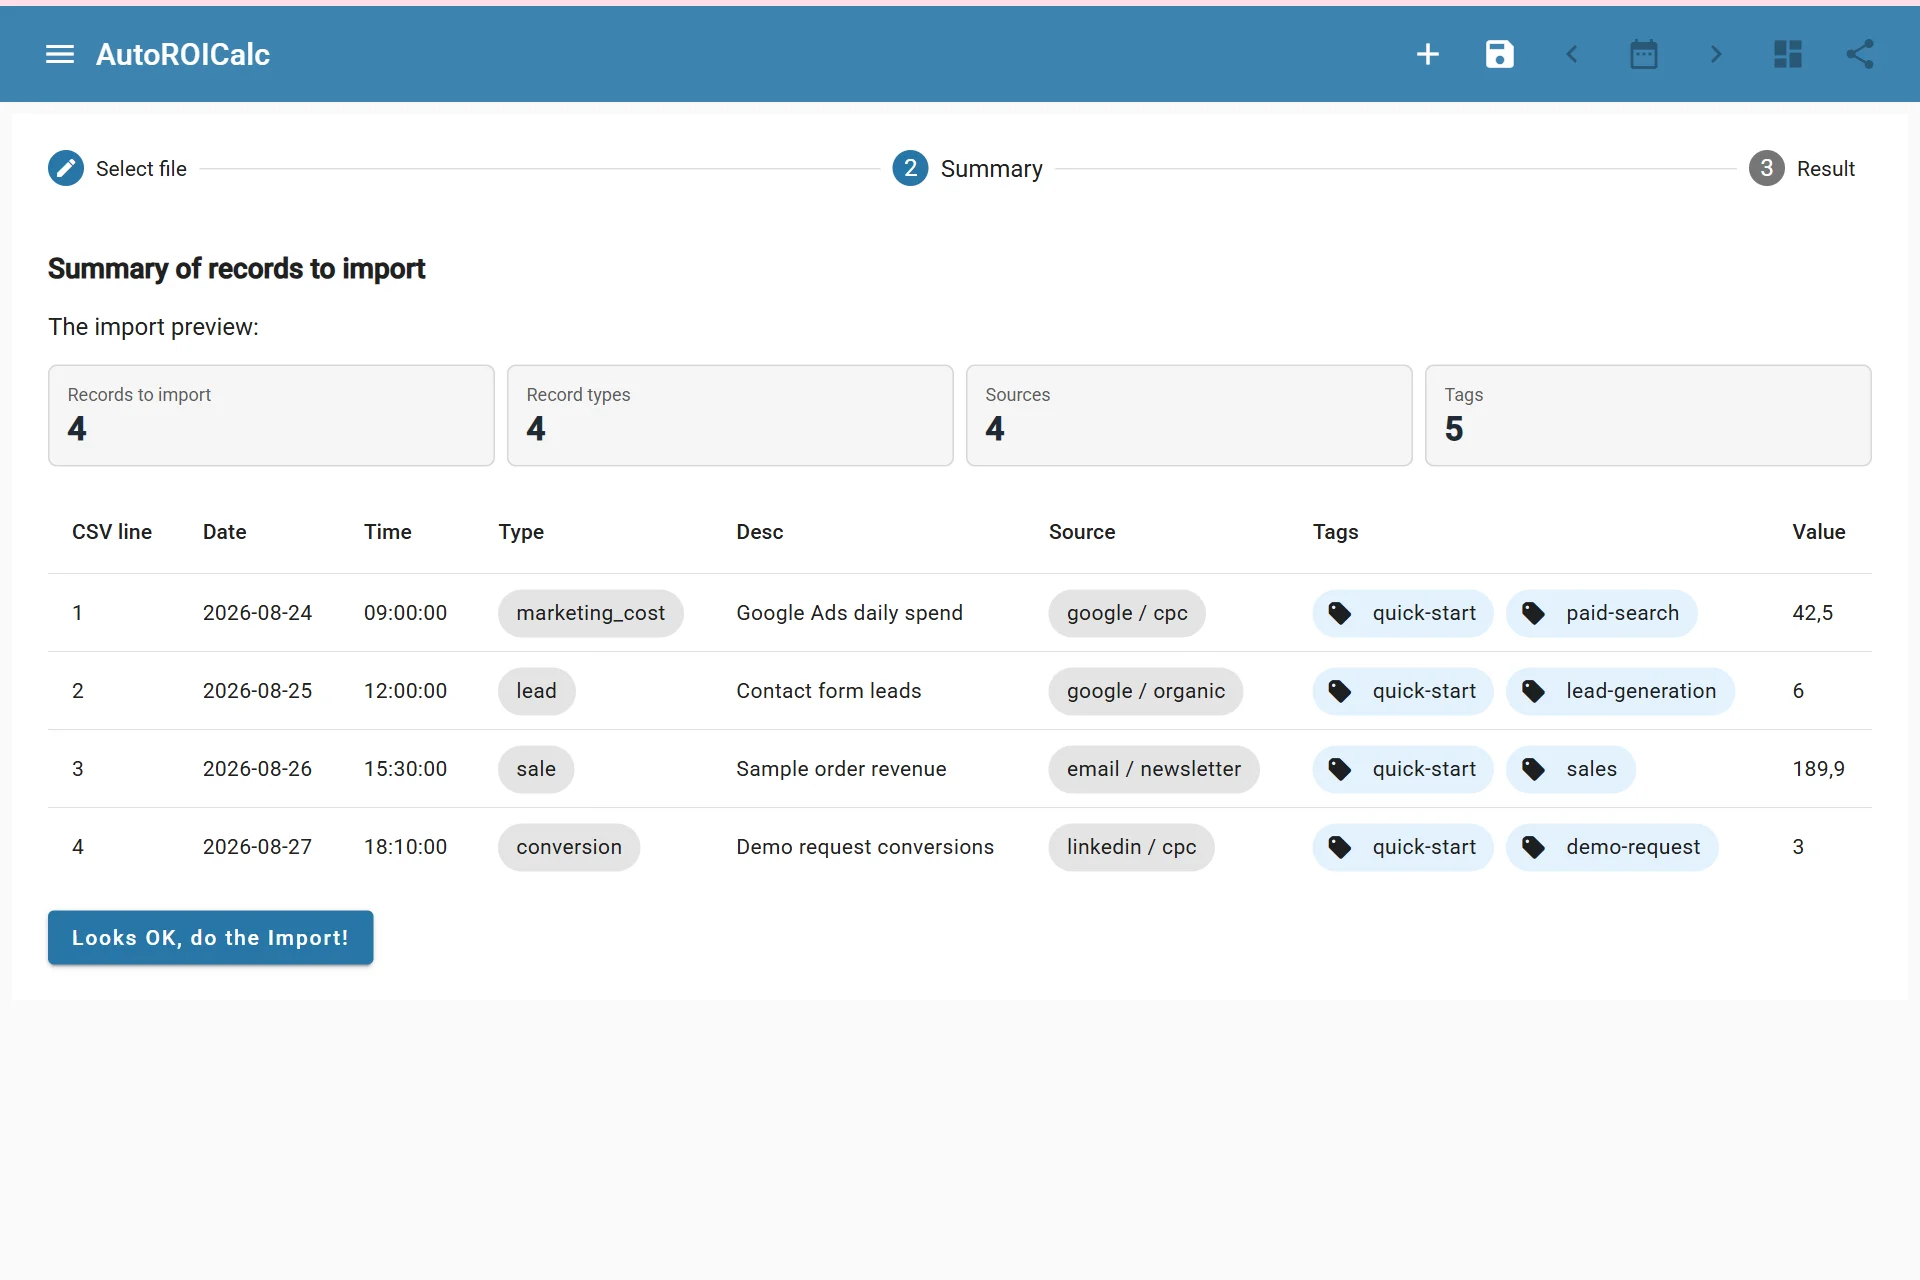
Importing sample records from CSV
4. Build Your First Report
Did you import the demo data?
If you imported the demo data, you can skip this section.
Create a report from the records you added. Choose a reporting period, then add report items that calculate the values you want to track.
Common first reports include:
- Conversions by source
- Costs over time
- Cost per conversion
- ROI by campaign
- Sales or lead value by source
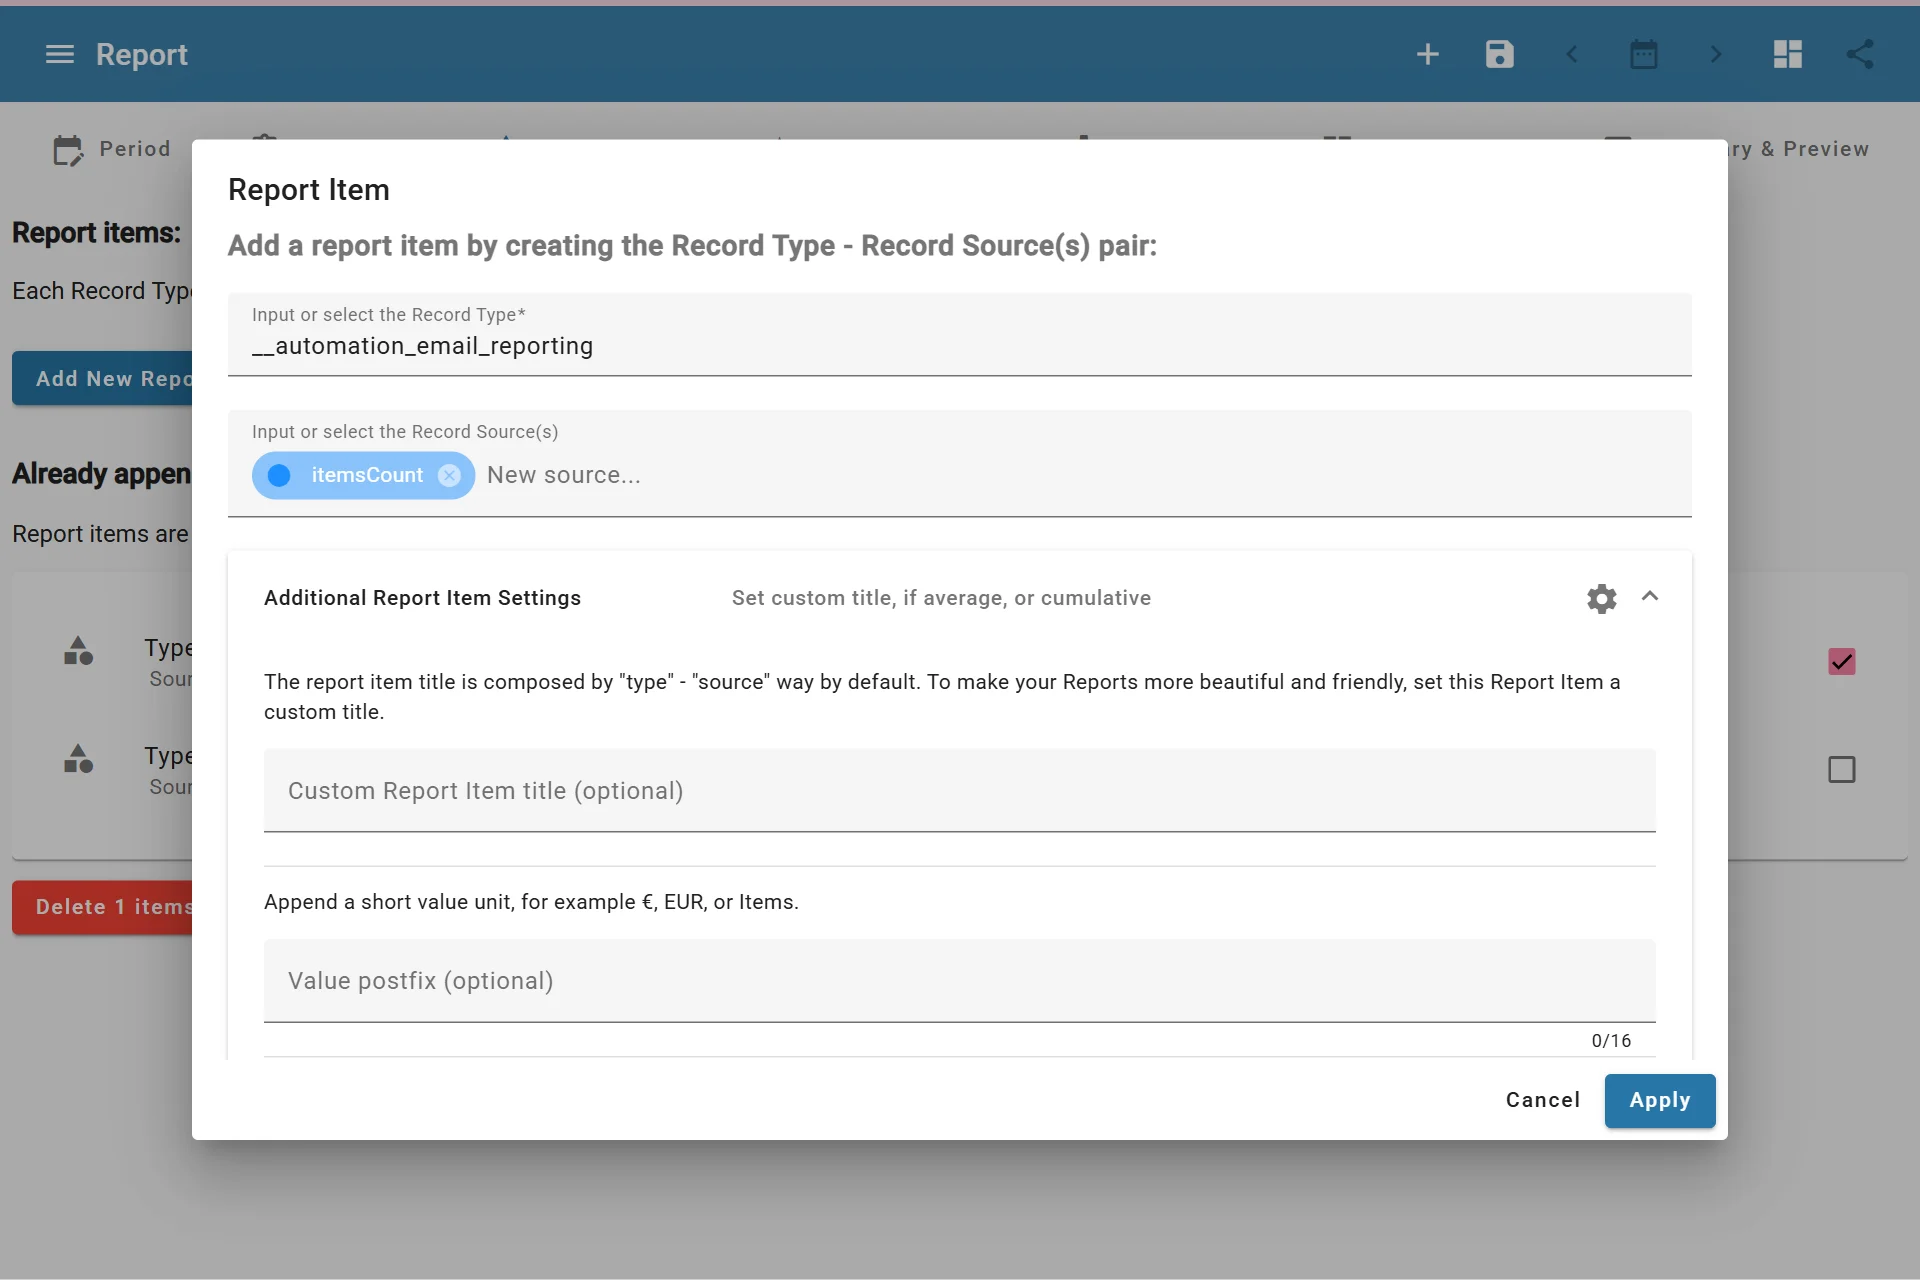
Updating existing report item
5. Add, Update, or Adjust Report Widgets
Use widgets to make the report easier to read.
Good first widgets:
- Data Value for a headline metric
- Line Chart for trends over time
- Sources Distribution for source comparison
- Data Table for checking the raw values behind the report
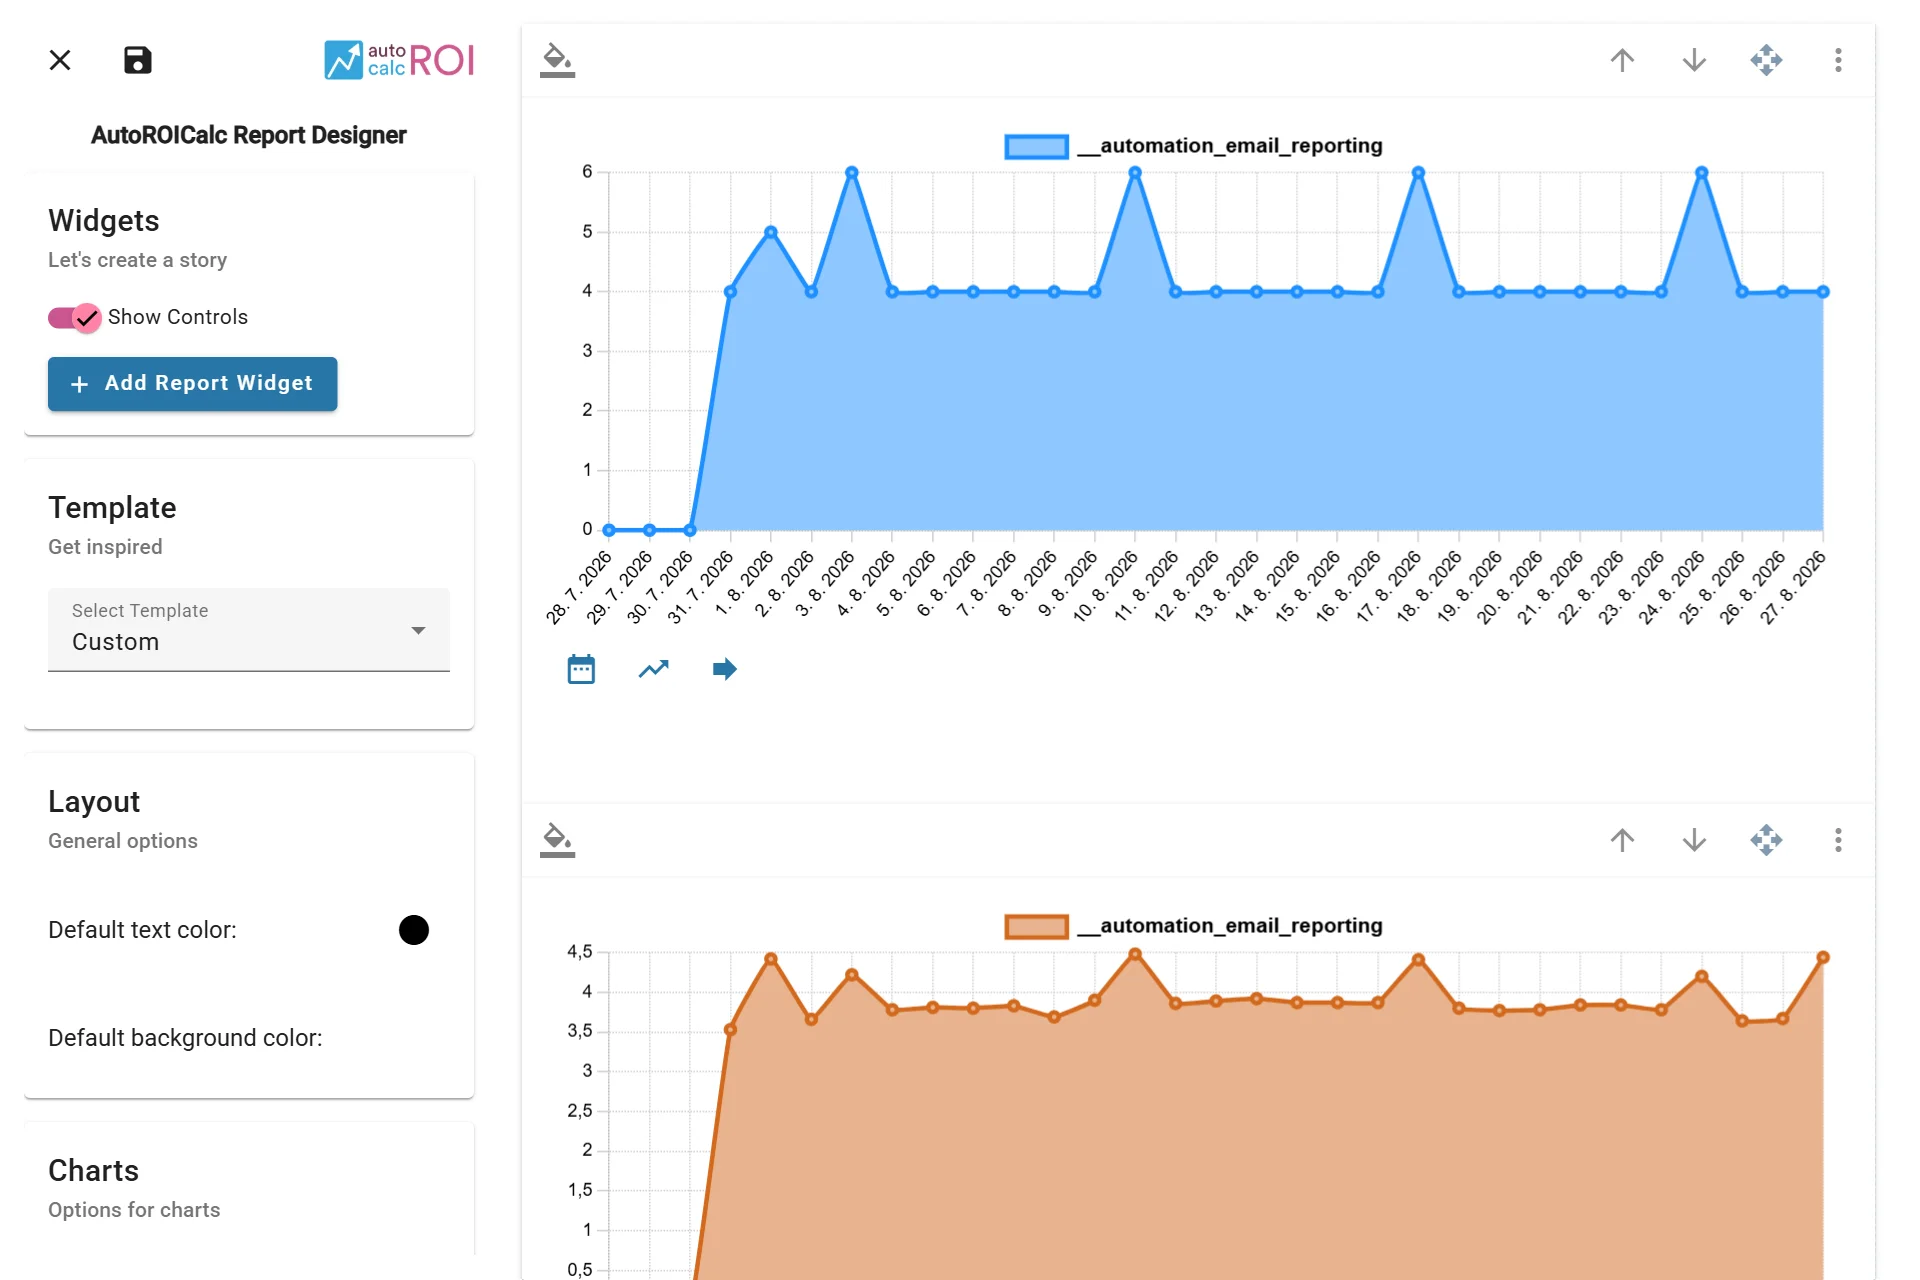
Using the report designer
6. Create a Dashboard
Group related reports
Dashboards are useful for grouping related reports together.
Add your report to a dashboard so it can be viewed together with other reports.
Dashboards are useful when you want to monitor multiple metrics, share a view with others, or send regular e-mail summaries.
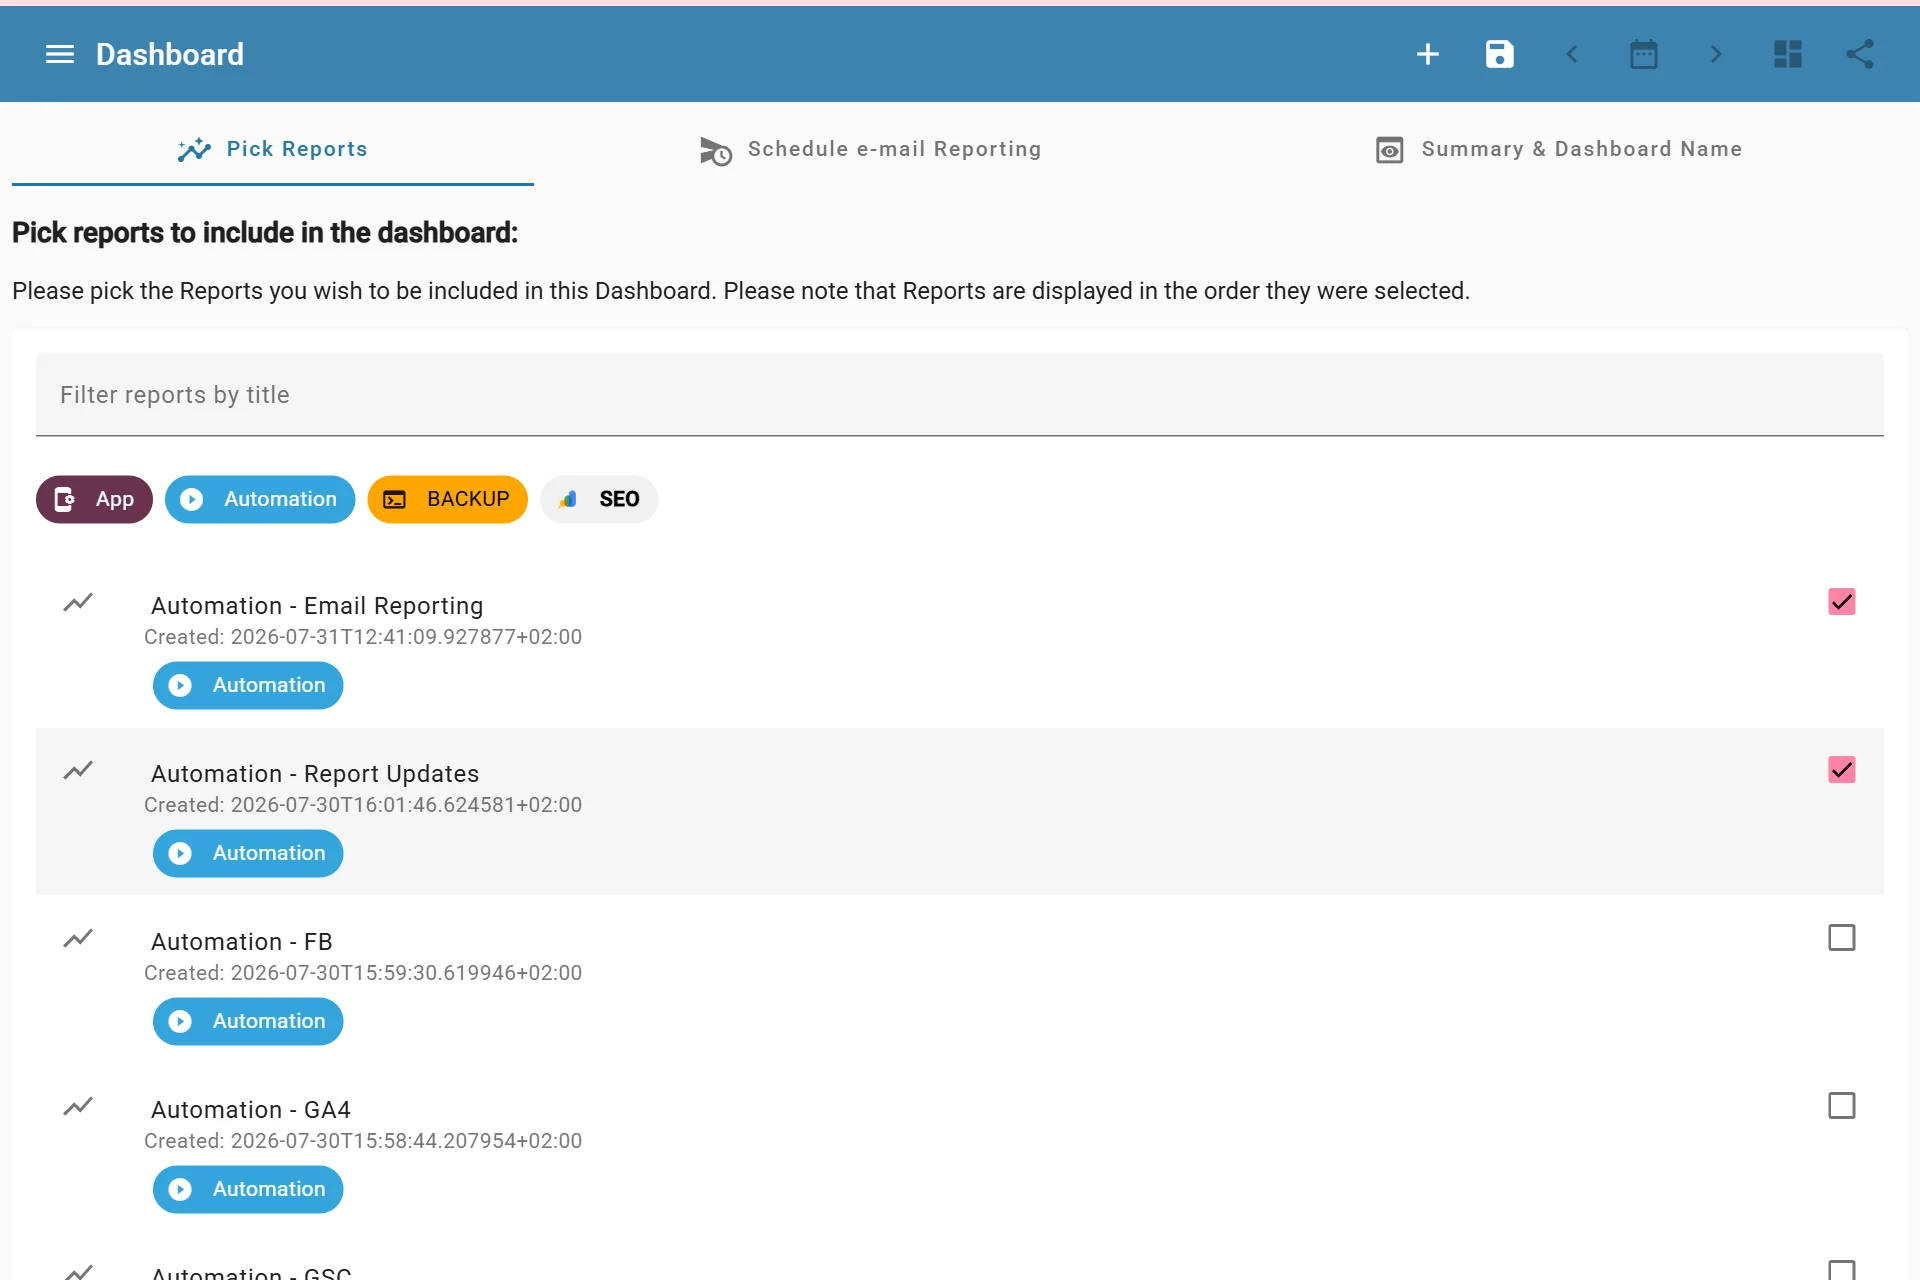
Adding related reports to a dashboard
7. Automate the Data Flow
Set up automated e-mail reporting
A common and useful automation is scheduled e-mail reporting. You can configure it directly in the dashboard settings.
Once the first report is useful, reduce manual work.
You can automate data collection with:
- Imports
- Web event capture
- Google Search Console
- Google Analytics
- Facebook Ads Manager
- API access
- CLI tools for self-hosted deployments