Reports Overview
AutoROICalc reports turn records into business reporting, ROI tracking, campaign analysis, and dashboard-ready insights. A report selects the records you want to analyze, groups them by time, calculates report items, and can enrich the results with additional metrics such as ROI, cost per conversion, percentage change, or custom formulas.
Reports are useful when you want to understand how business activities develop over time, compare sources or campaigns, monitor costs and conversions, or prepare reusable reporting views for dashboards and clients.
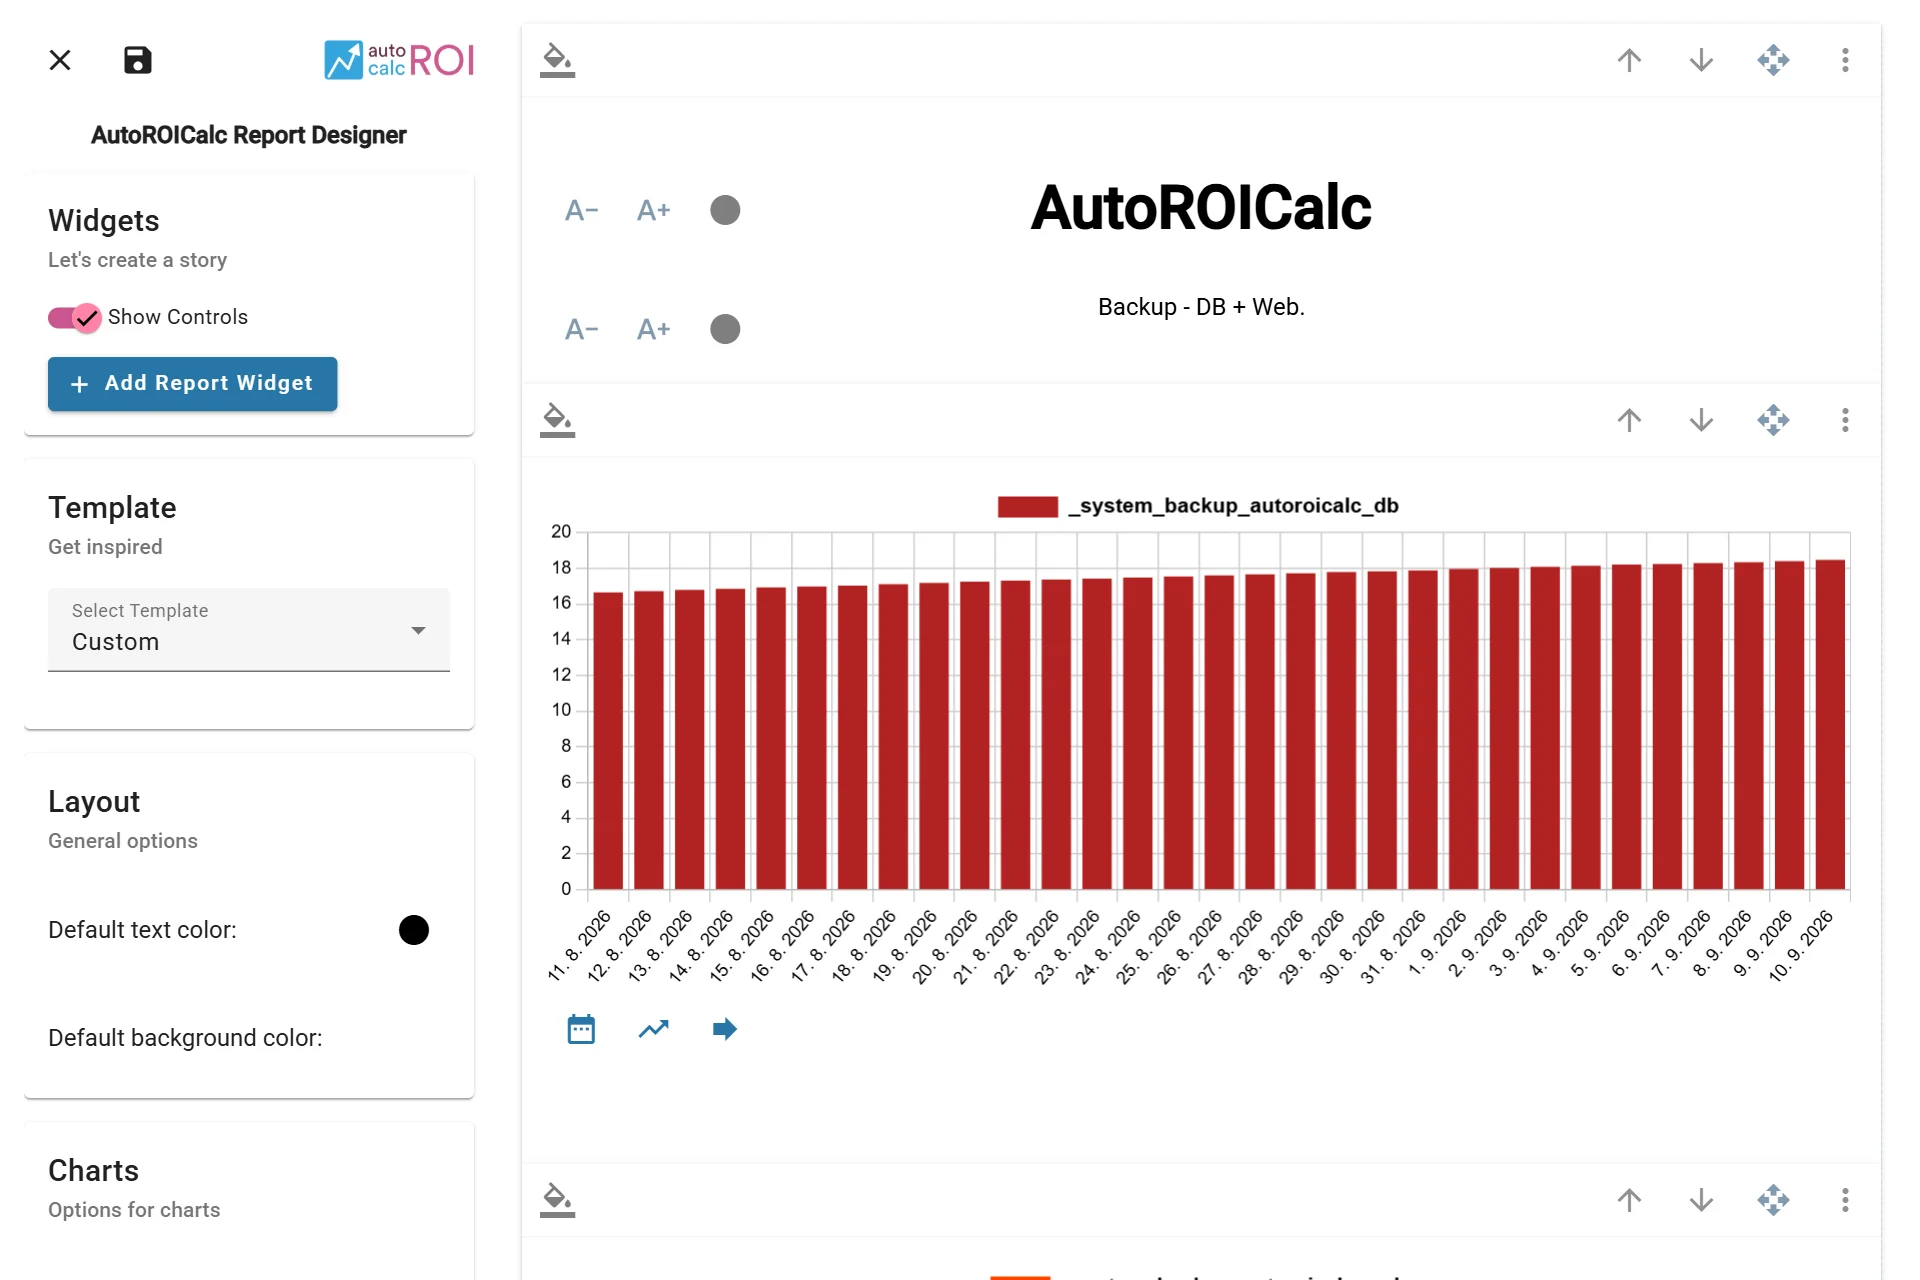
AutoROICalc Report Designer
Start with a simple report
Begin with one or two report items and a clear date range. After the first report works, add enrichment, automation, or an advanced layout.
What a Report Contains
A report configuration usually includes:
| Area | Purpose |
|---|---|
| Reporting period | Defines which records are included by date |
| Time base | Defines how records are grouped on the chart and table |
| Report items | Defines which record types and sources are calculated |
| Data enrichment | Adds calculated metrics from existing report items |
| Automation | Sends notifications or updates reports based on report values and date rules |
| Report layout | Controls the default view or advanced report designer layout |
| Customization | Adjusts report appearance, colors, chart styles, templates, and widget display options |
| Name, description, and tags | Helps identify, organize, and reuse saved reports |
Report Workflow
-
Create a Report
Build a report from records by choosing the period, time base, report items, enrichment, automation, and layout.
-
Managing Reports
Access saved reports, filter by name or tags, view, edit, clone, share, or delete reports.
-
Use Reports in Dashboards
Add saved reports to dashboards so several reporting views can be monitored together.
-
Import, Export, and Reuse
Move reports with ARC files, export report bundles, save reusable templates, or install one-click solutions.