Contribution Mix Widget
The Contribution Mix widget compares selected contribution items as a chart, such as a pie or donut. It can use record sources or custom breakdown data depending on the report data.
Inputs and Controls
| Control | Description |
|---|---|
| Title and description | Add context above the contribution view. |
| Appearance | Use extended, icons-only, or chart view. |
| Icon size | Set the icon size for non-chart views. |
| Chart type | Use a column, horizontal column, pie, or doughnut chart. |
| Data target | Use record sources or a custom breakdown. |
| Record type | Select the record type when using record sources. |
| Breakdown and metric | Select custom breakdown data when applicable. |
| Items | Add, label, reorder, recolor, and remove contribution items. |
| Maximum items | The widget supports up to six selected items. |
Tips and good uses
Tips
- Keep the number of contribution items focused.
- Use it for share-of-total questions.
- Use consistent colors when repeating the same items across reports.
Good uses
- Channel contribution mix
- Product or campaign share
- Revenue split by selected items
- Custom breakdown contribution comparison
Configuration and Usage
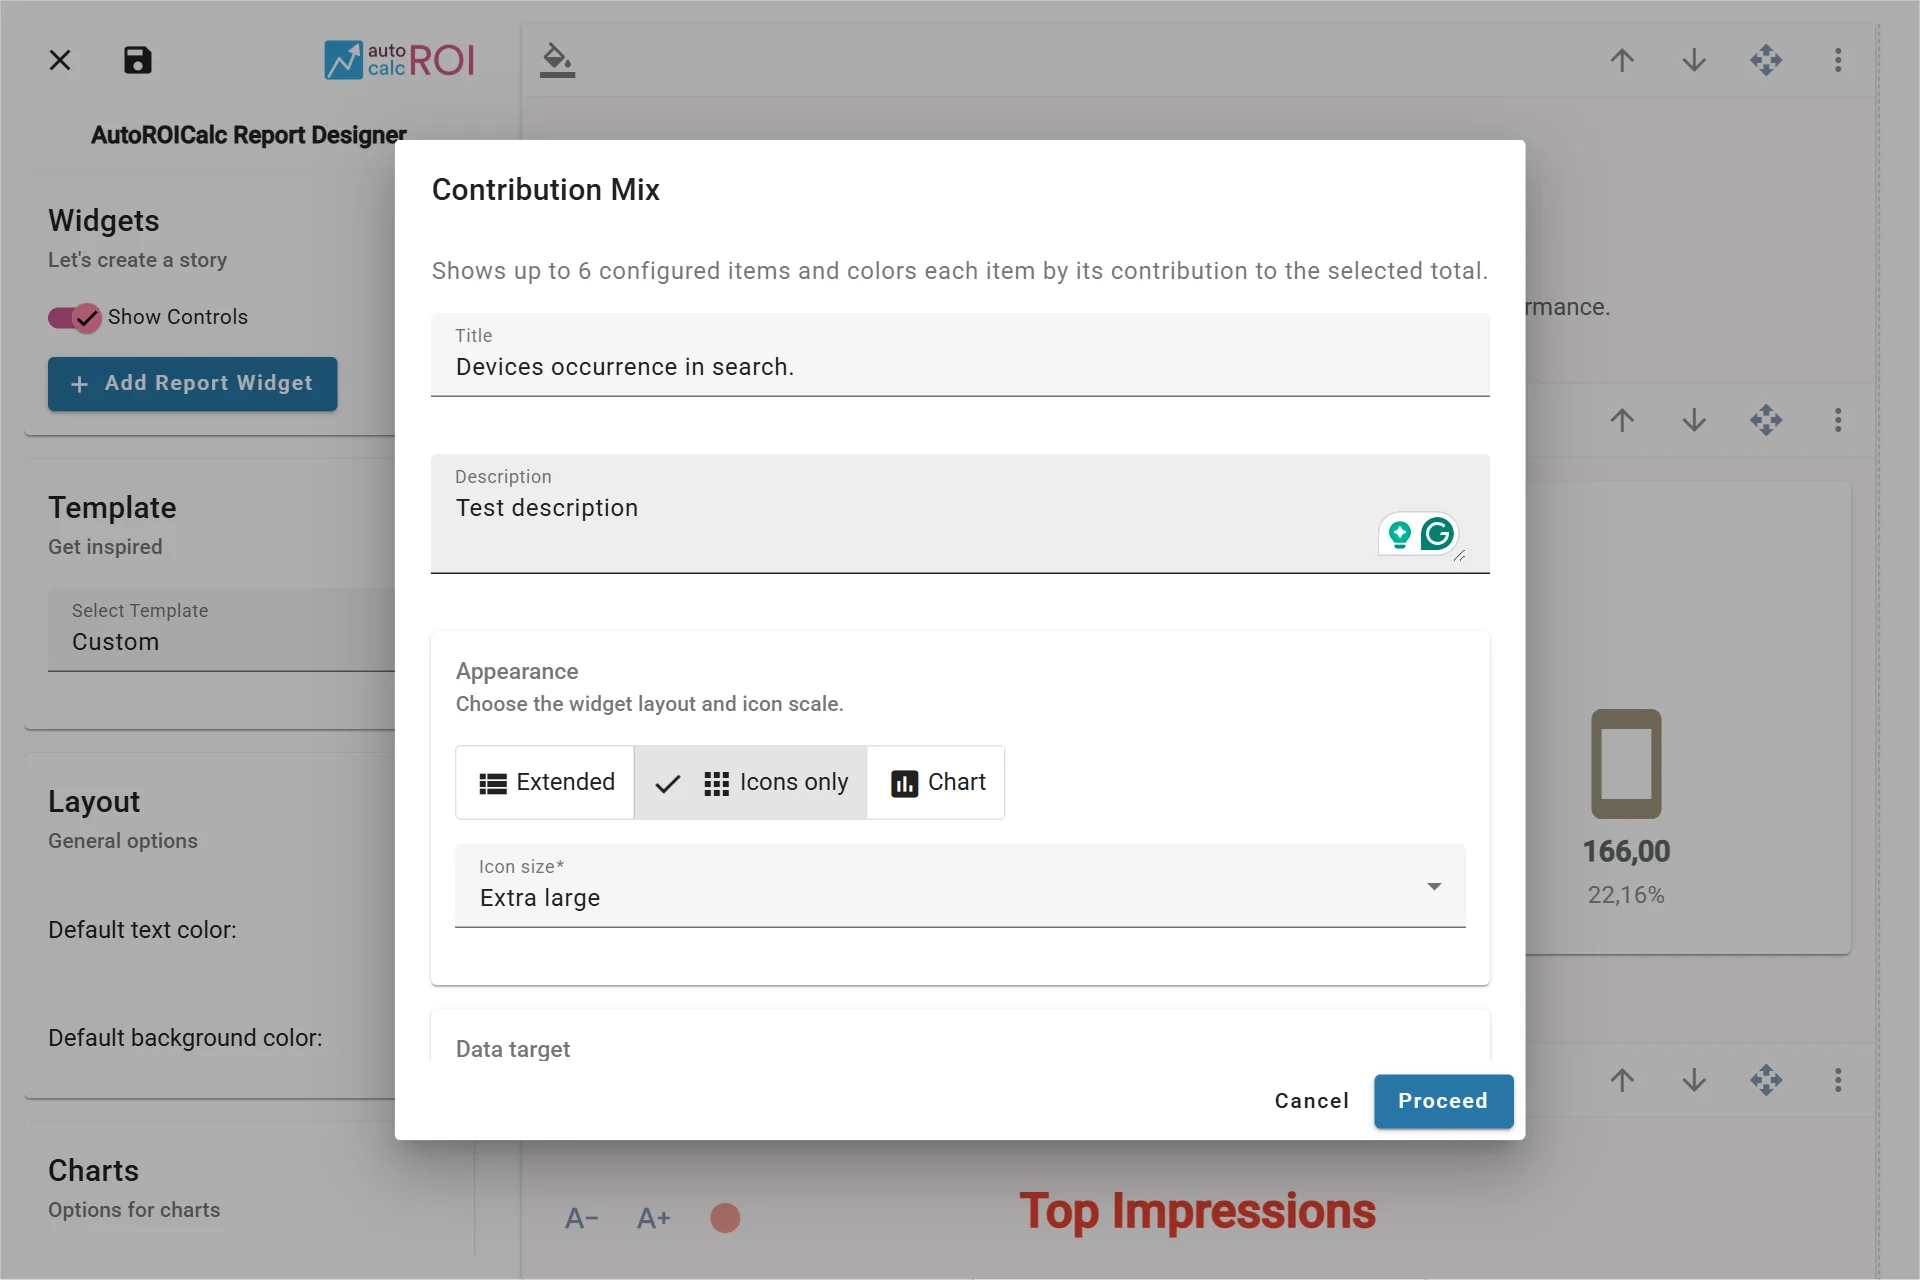
Configuring the Contribution Mix Widget
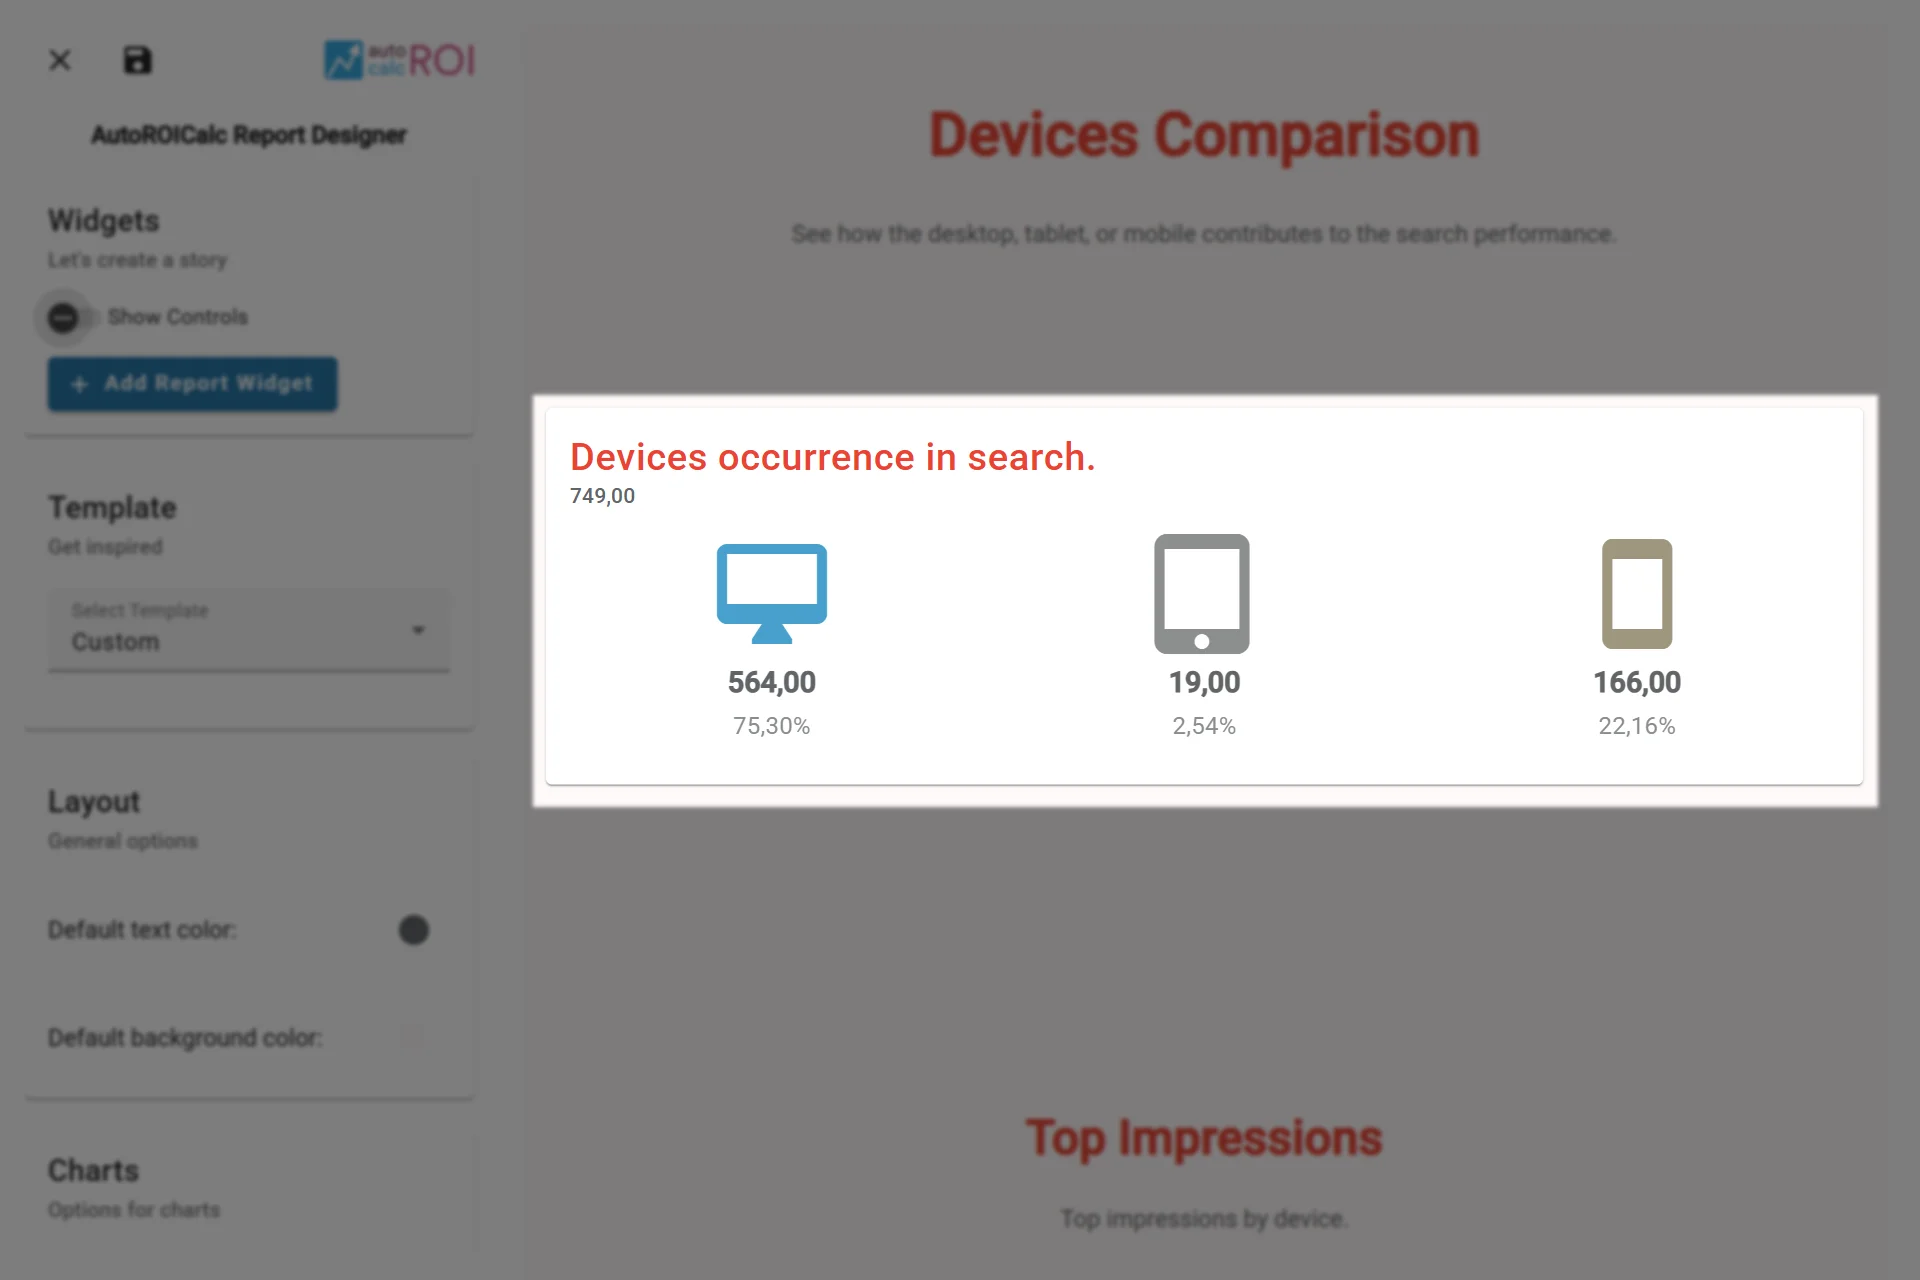
A sample usage of the Contribution Mix Widget