Report Items
Report items define what a report calculates. Each report item selects a record type and one or more record sources. AutoROICalc then finds matching records and calculates the values for the selected period and time base.
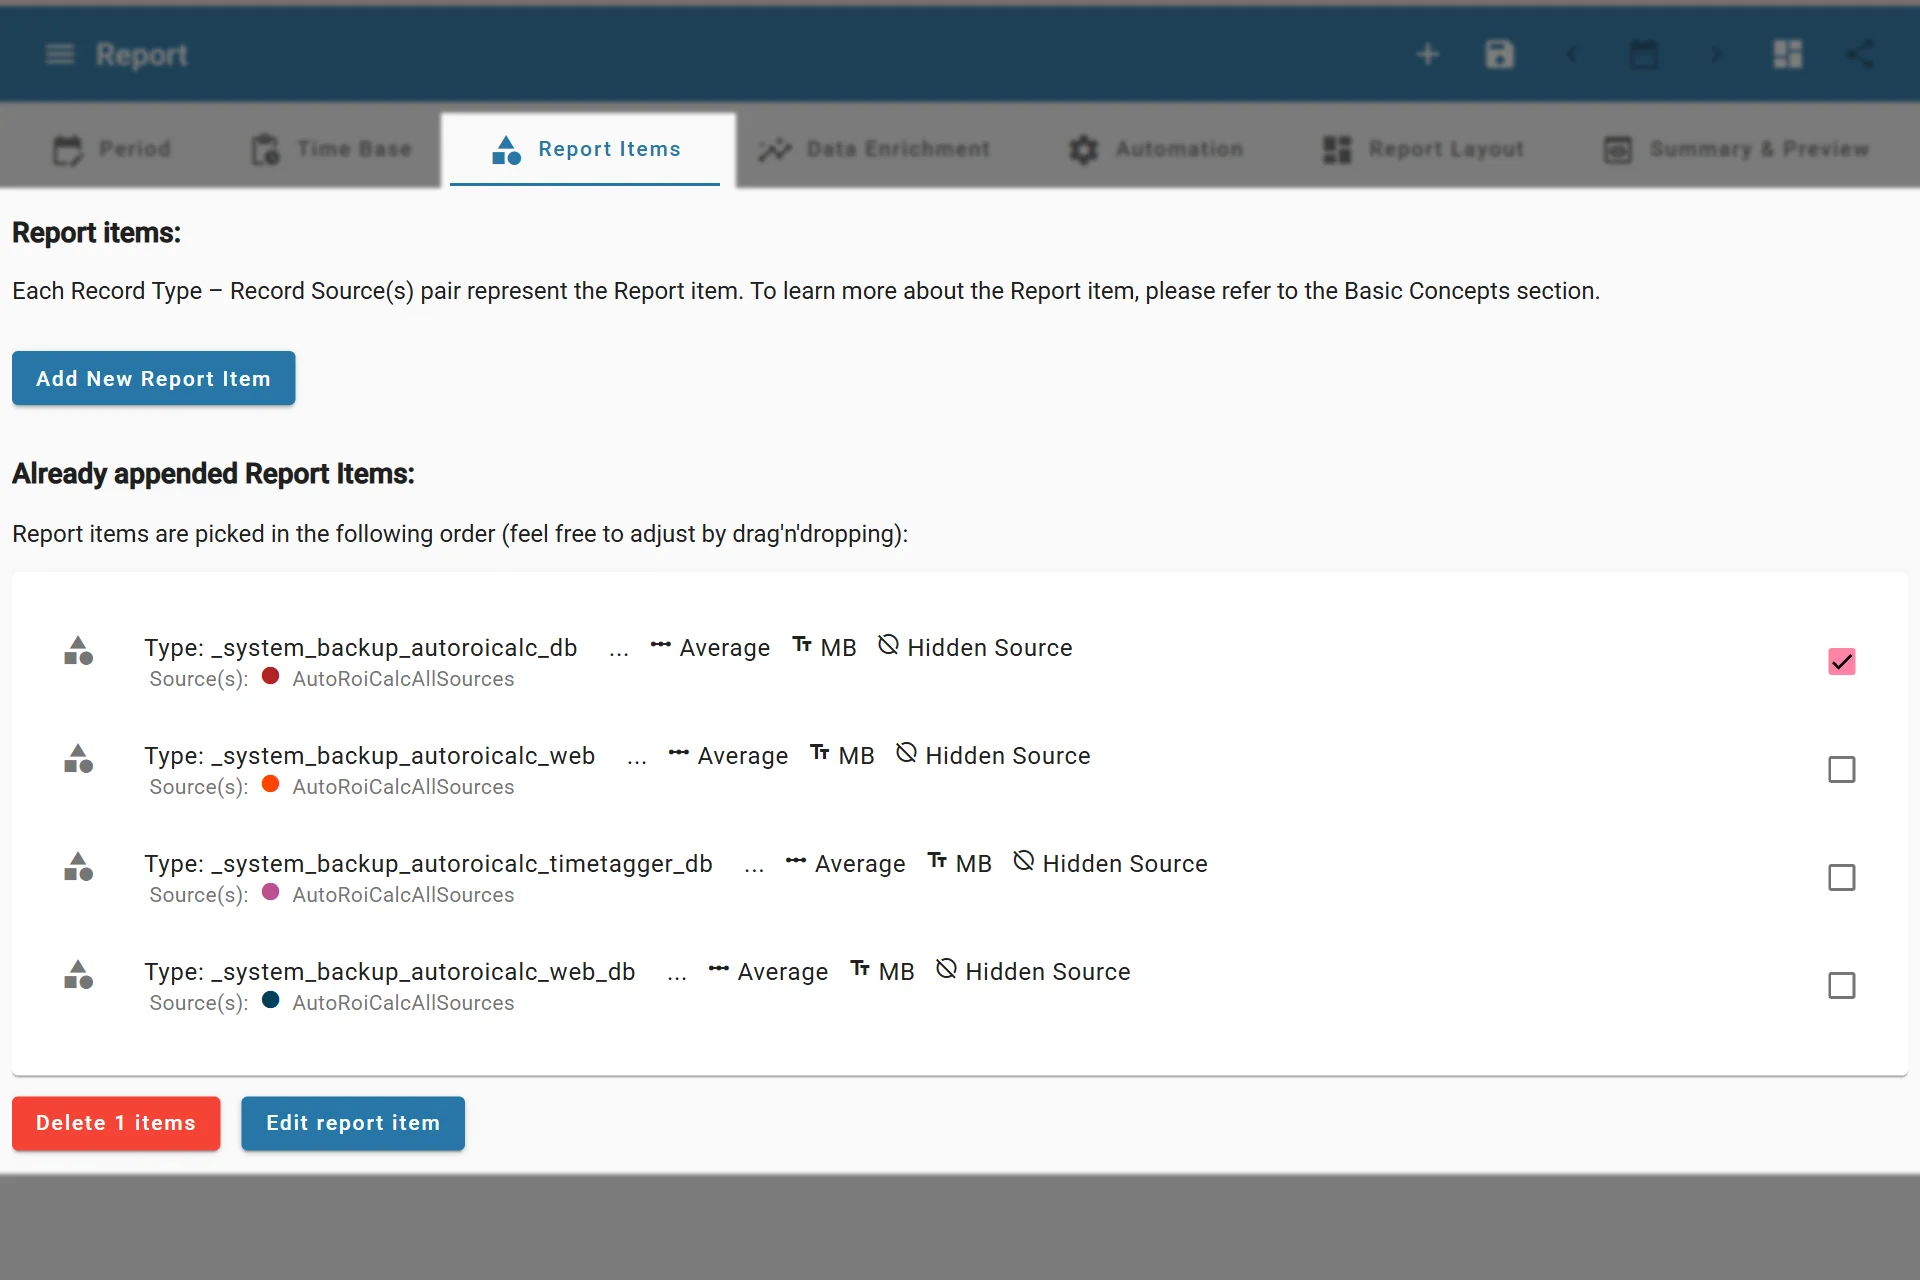
Accessing Report Items
How Report Items Work
A report item is based on:
- Record type
- Record source or sources
- Optional display settings
- Optional calculation settings
For example, a report item can calculate all sale records from woocommerce, or all lead records from google / cpc and linkedin / organic.
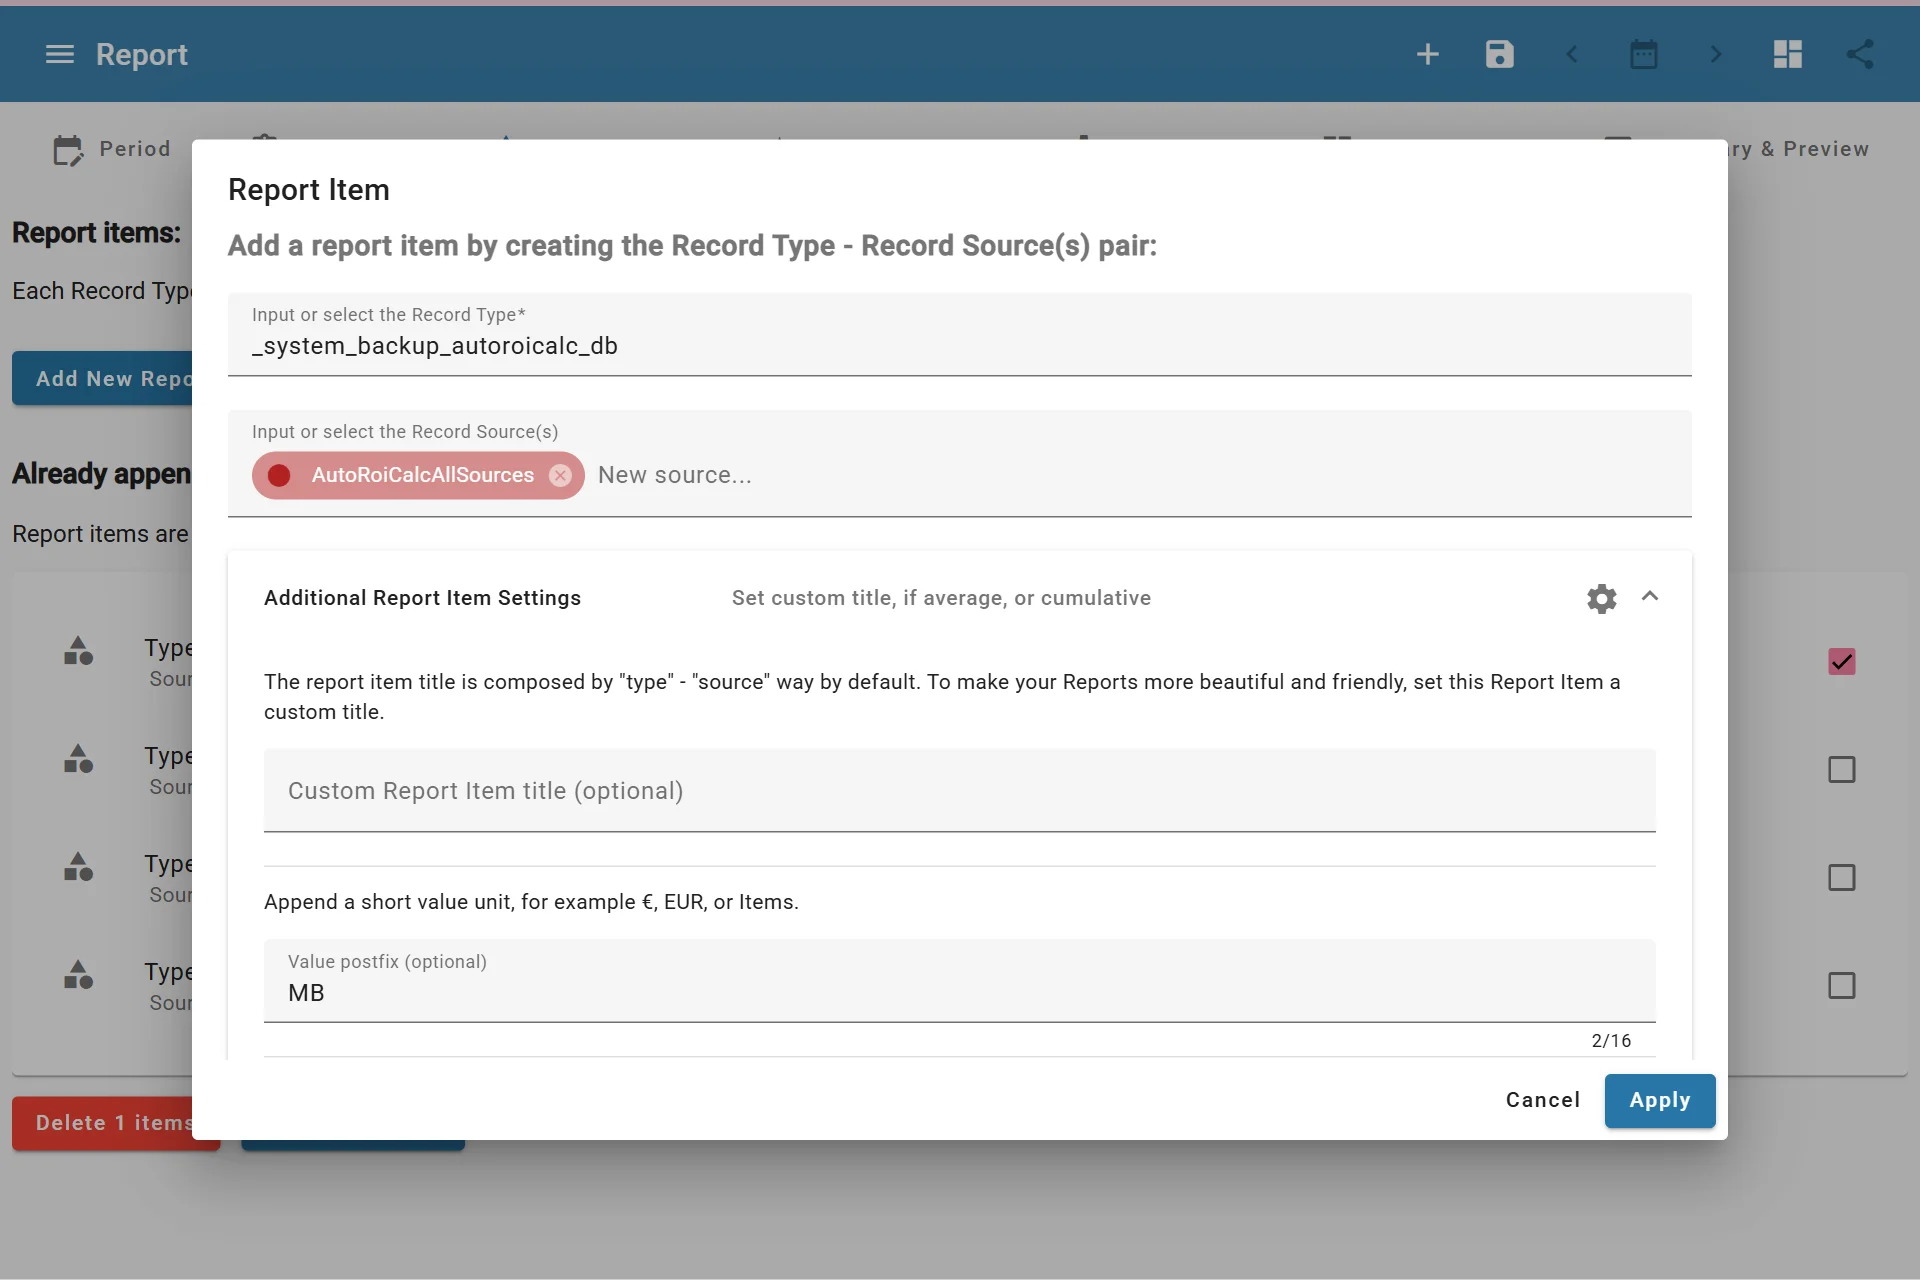
Configuring Report Items
Record Type
The record type describes the business activity being calculated, such as cost, lead, sale, conversion, click, impression, signup, or purchase.
Use consistent record types across records. Consistency makes reports easier to configure and compare.
Record type is what you report on
When deciding what to report, choose a specific record type, for example sale, lead, or cost.
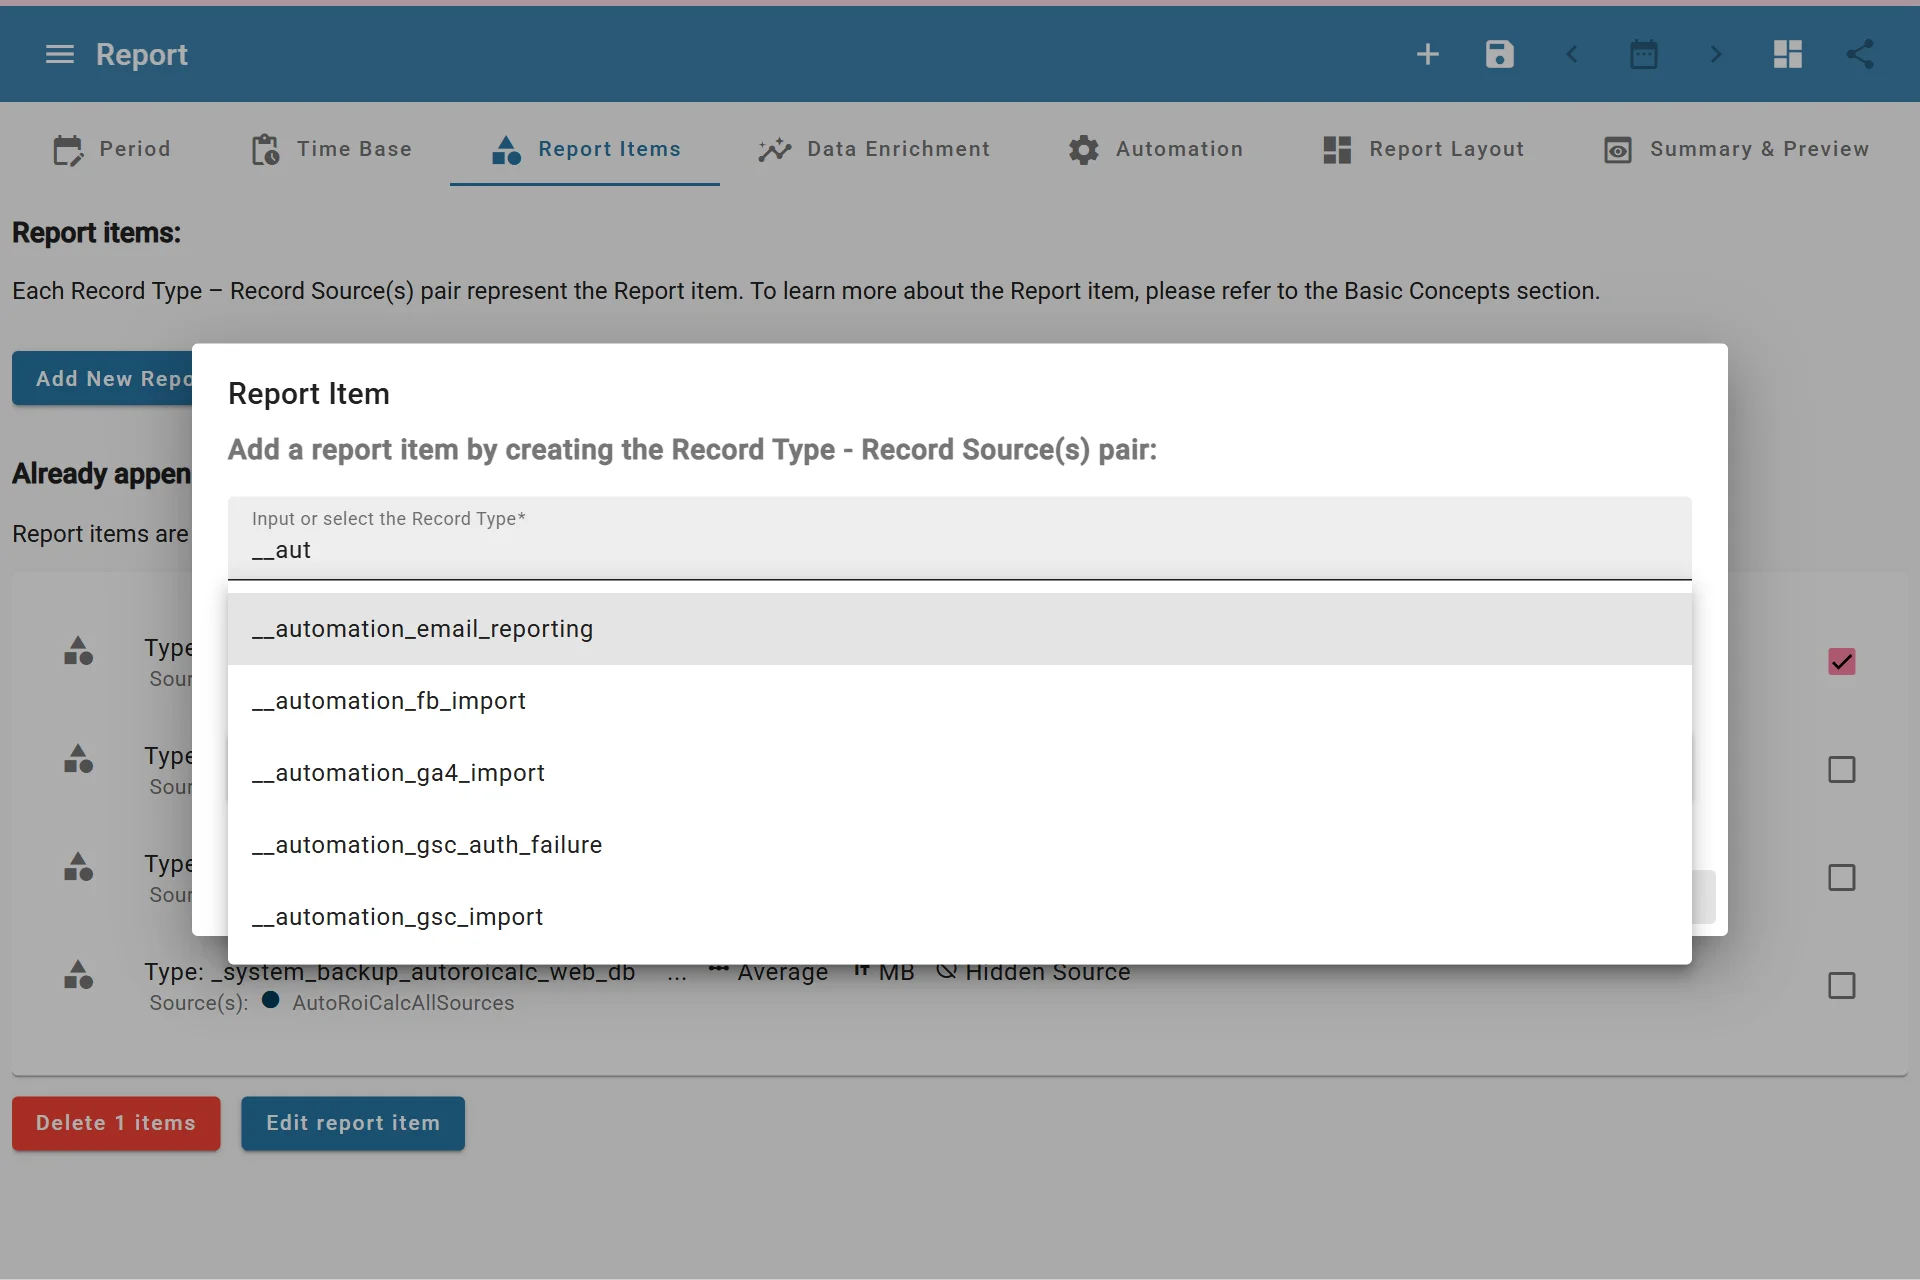
Selecting Record Type for Reporting
Record Sources
Sources describe where records came from. A report item can use one or more sources, such as:
google / cpclinkedin / organicnewsletterwoocommercecontact-form
When a report item contains multiple sources, AutoROICalc can calculate the combined value and show how sources contribute to the result.
All Sources and Exclusions
Enable Use all sources to include every source for the selected record type, including sources added later. This produces one aggregate dataset. Existing reports using AutoRoiCalcAllSources continue to work and open with this switch enabled.
Enable Exclude sources to enter exclusion chips. Each chip matches any part of a source name, ignoring case: allegro matches a-allegro-b and Allegro / paid. A match against any chip is sufficient. Exclusions take precedence over included sources.
The Exclude entire matching records switch controls how multi-source records are treated:
- Off (default): Remove only the matching sources' contributions. A record worth 100 with sources
newsletterandallegroretains 50 fornewsletter. The removed share is not redistributed. - On: Remove the entire record if any source matches an exclusion. The same record contributes 0.
Exclusions belong to each report item. Report-level source distributions, conversion paths, and breakdowns use the union of the contributing report items. Another item may intentionally include a source excluded by the first. Period-wide Mix widgets retain their independent scope.
Disabling exclusions preserves the entered chips for later use.
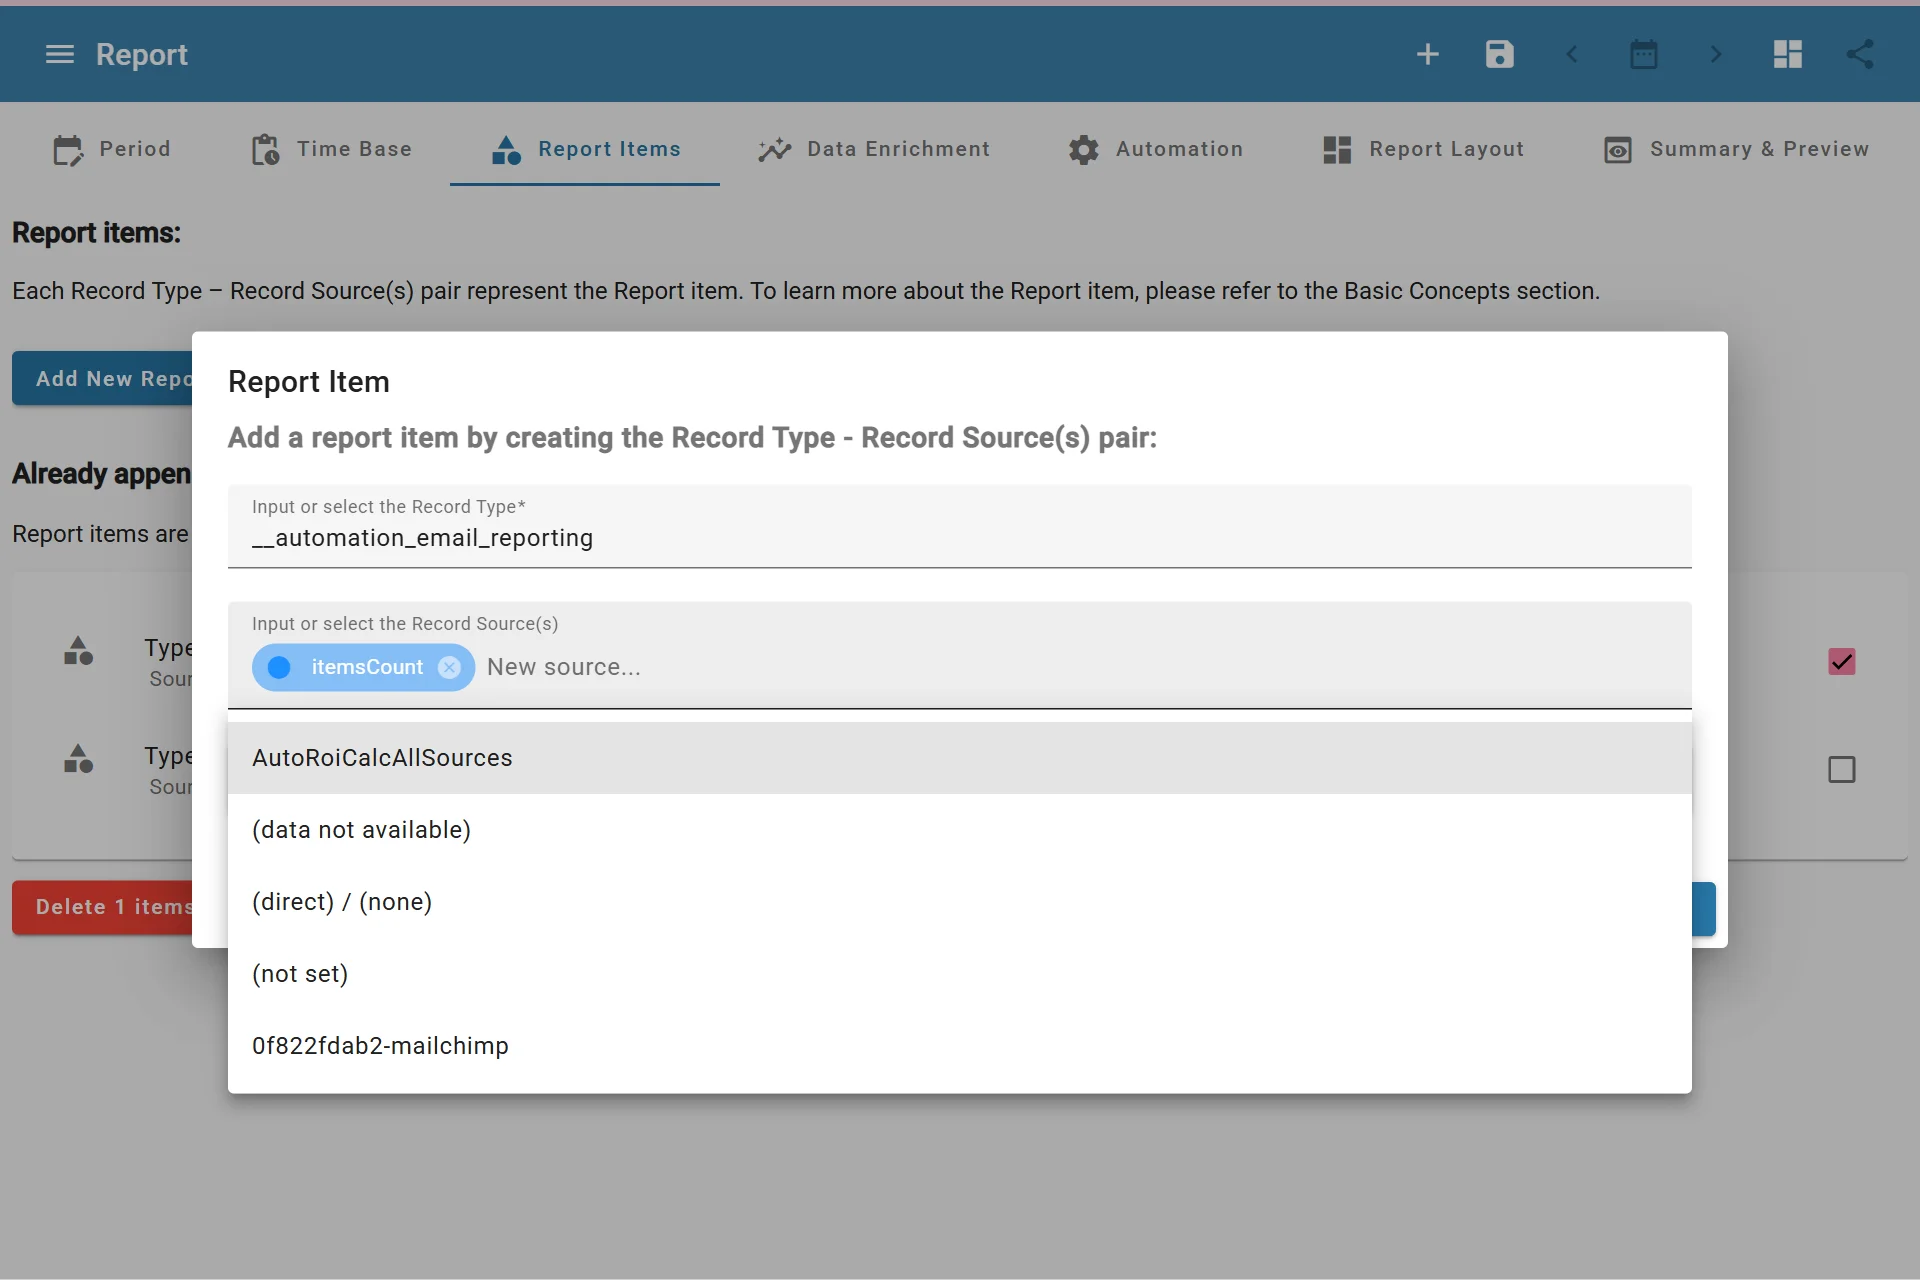
Selecting Report Item Sources
Report Item Settings
Additional report item settings can help with presentation and calculations:
| Setting | Purpose |
|---|---|
| Custom title | Shows a clearer label instead of the default type/source title |
| Value postfix | Adds a suffix such as %, EUR, orders, or leads |
| Integer results | Rounds combined results to whole numbers while retaining precise fractional source contributions |
| Value rounding | Controls decimal places; with Integer results enabled, applies to source contribution displays |
| Hide source | Useful when the source should not appear in the label |
| Average | Calculates average values instead of summed values |
| Cumulative | Shows values accumulated over time |
| Prefer color fill | Uses filled visual styles where applicable |
| Prefer border patterns | Adds pattern-based distinction where applicable |
Integer results is off by default. Enable it for counts such as transactions. Source shares retain their precision until aggregation, so three one-third contributions combine to 1. Charts show whole-number points, while headline totals and enrichment formulas use the precise underlying values across dates. Source rows and attribution percentages retain fractional contributions. Derived metrics use their own rounding settings.
Ordering Report Items
Report items are used in the order shown in the report builder. You can reorder them to make charts, tables, and enrichment formulas easier to read.