Data Table Widget
The Data Table widget shows detailed report values in a table. Use it when readers need exact numbers, not only charts or headline values.
Inputs and Controls
| Control | Description |
|---|---|
| Filter report datasets | Limit the table to selected report datasets. |
| Dataset selection | Choose visible datasets when filtering is enabled. |
Tips and good uses
Tips
- Use tables after charts when readers need details.
- Keep report item names short enough for table columns.
- Avoid making the table the only visual element in a polished layout.
Good uses
- Report item values by time period
- Detailed campaign results
- Enriched metrics in tabular form
- Supporting detail below a chart
Configuration and Usage
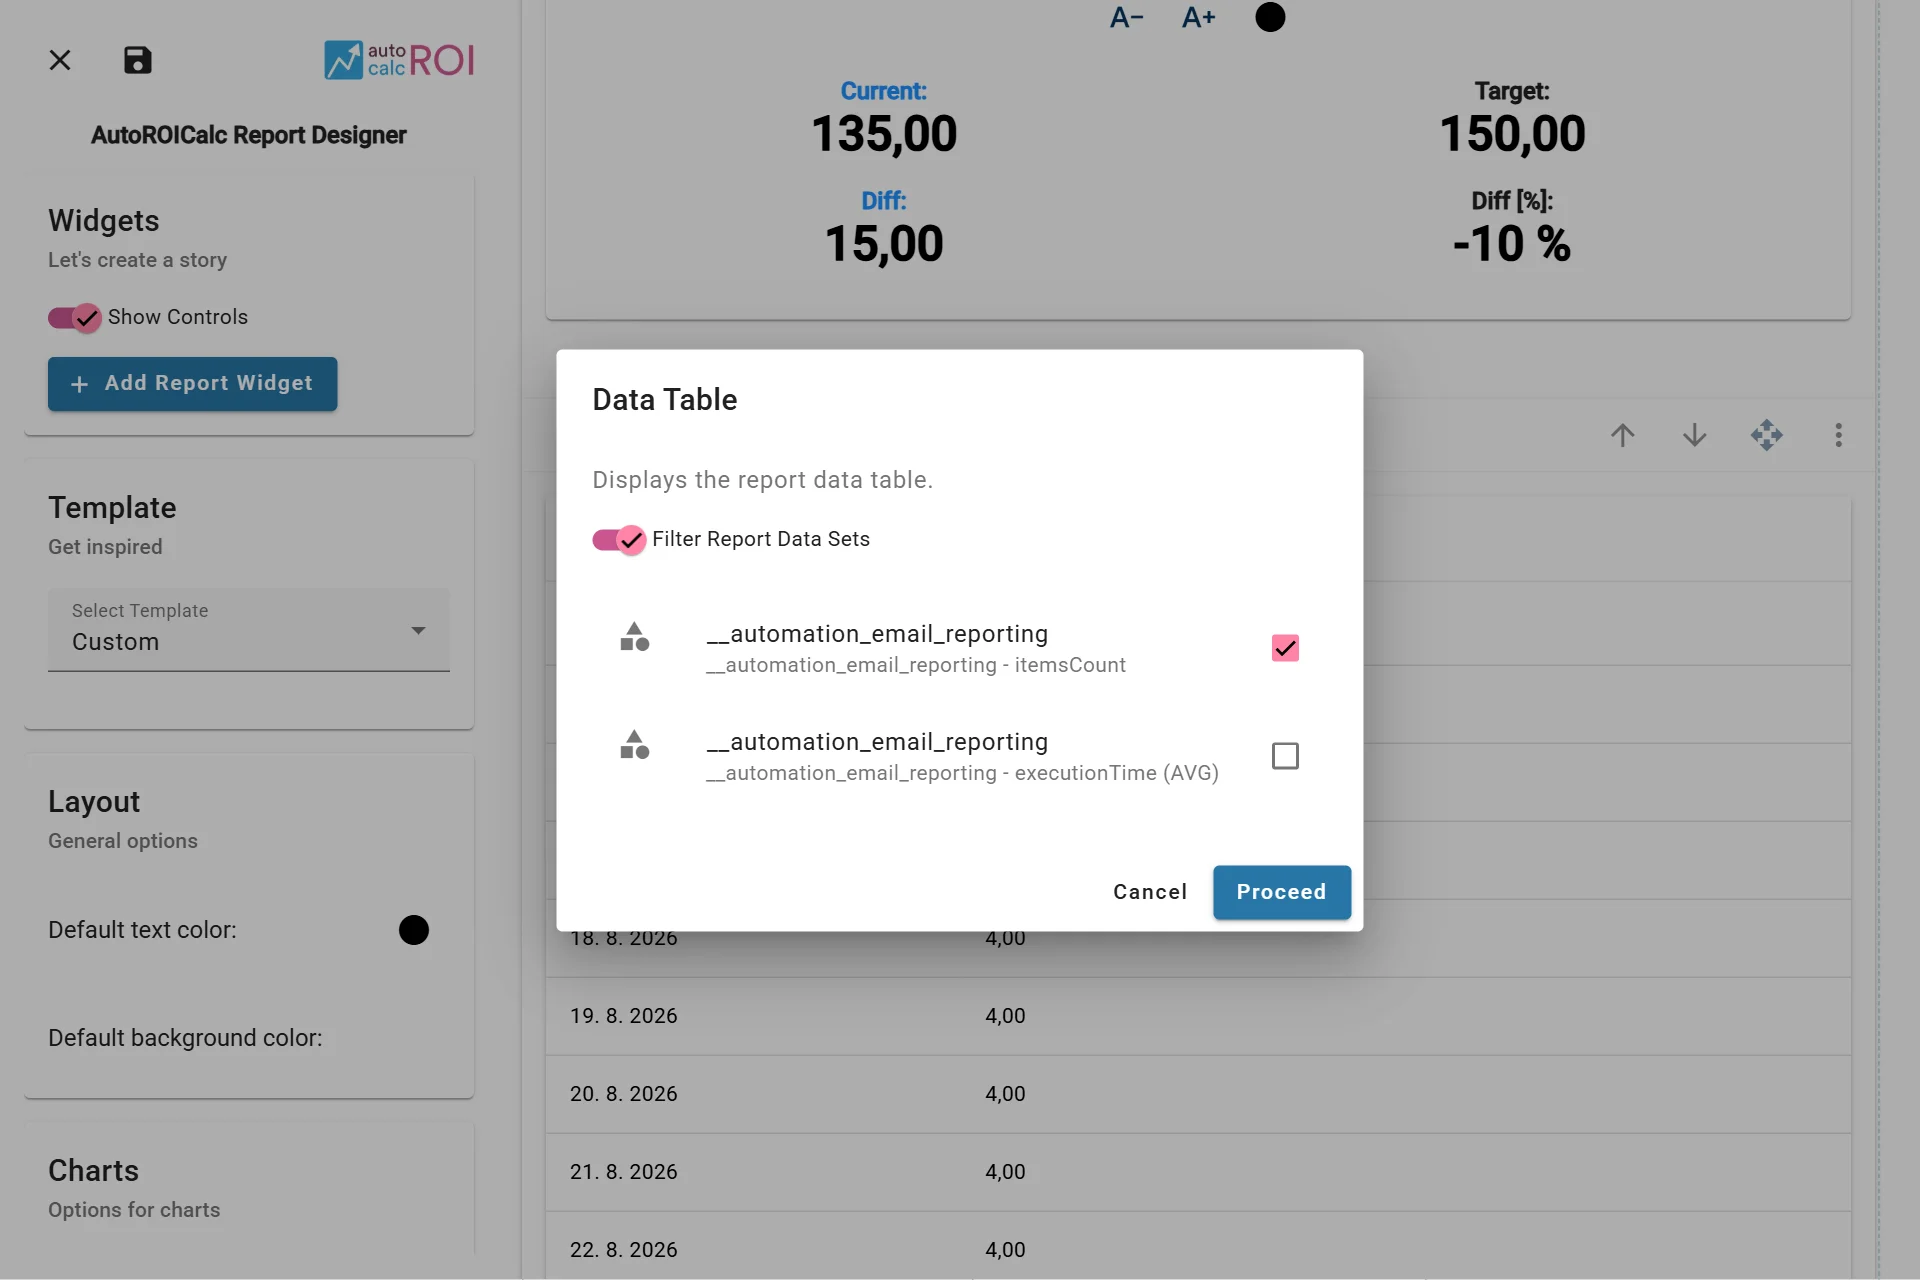
Configuring the Data Table Widget
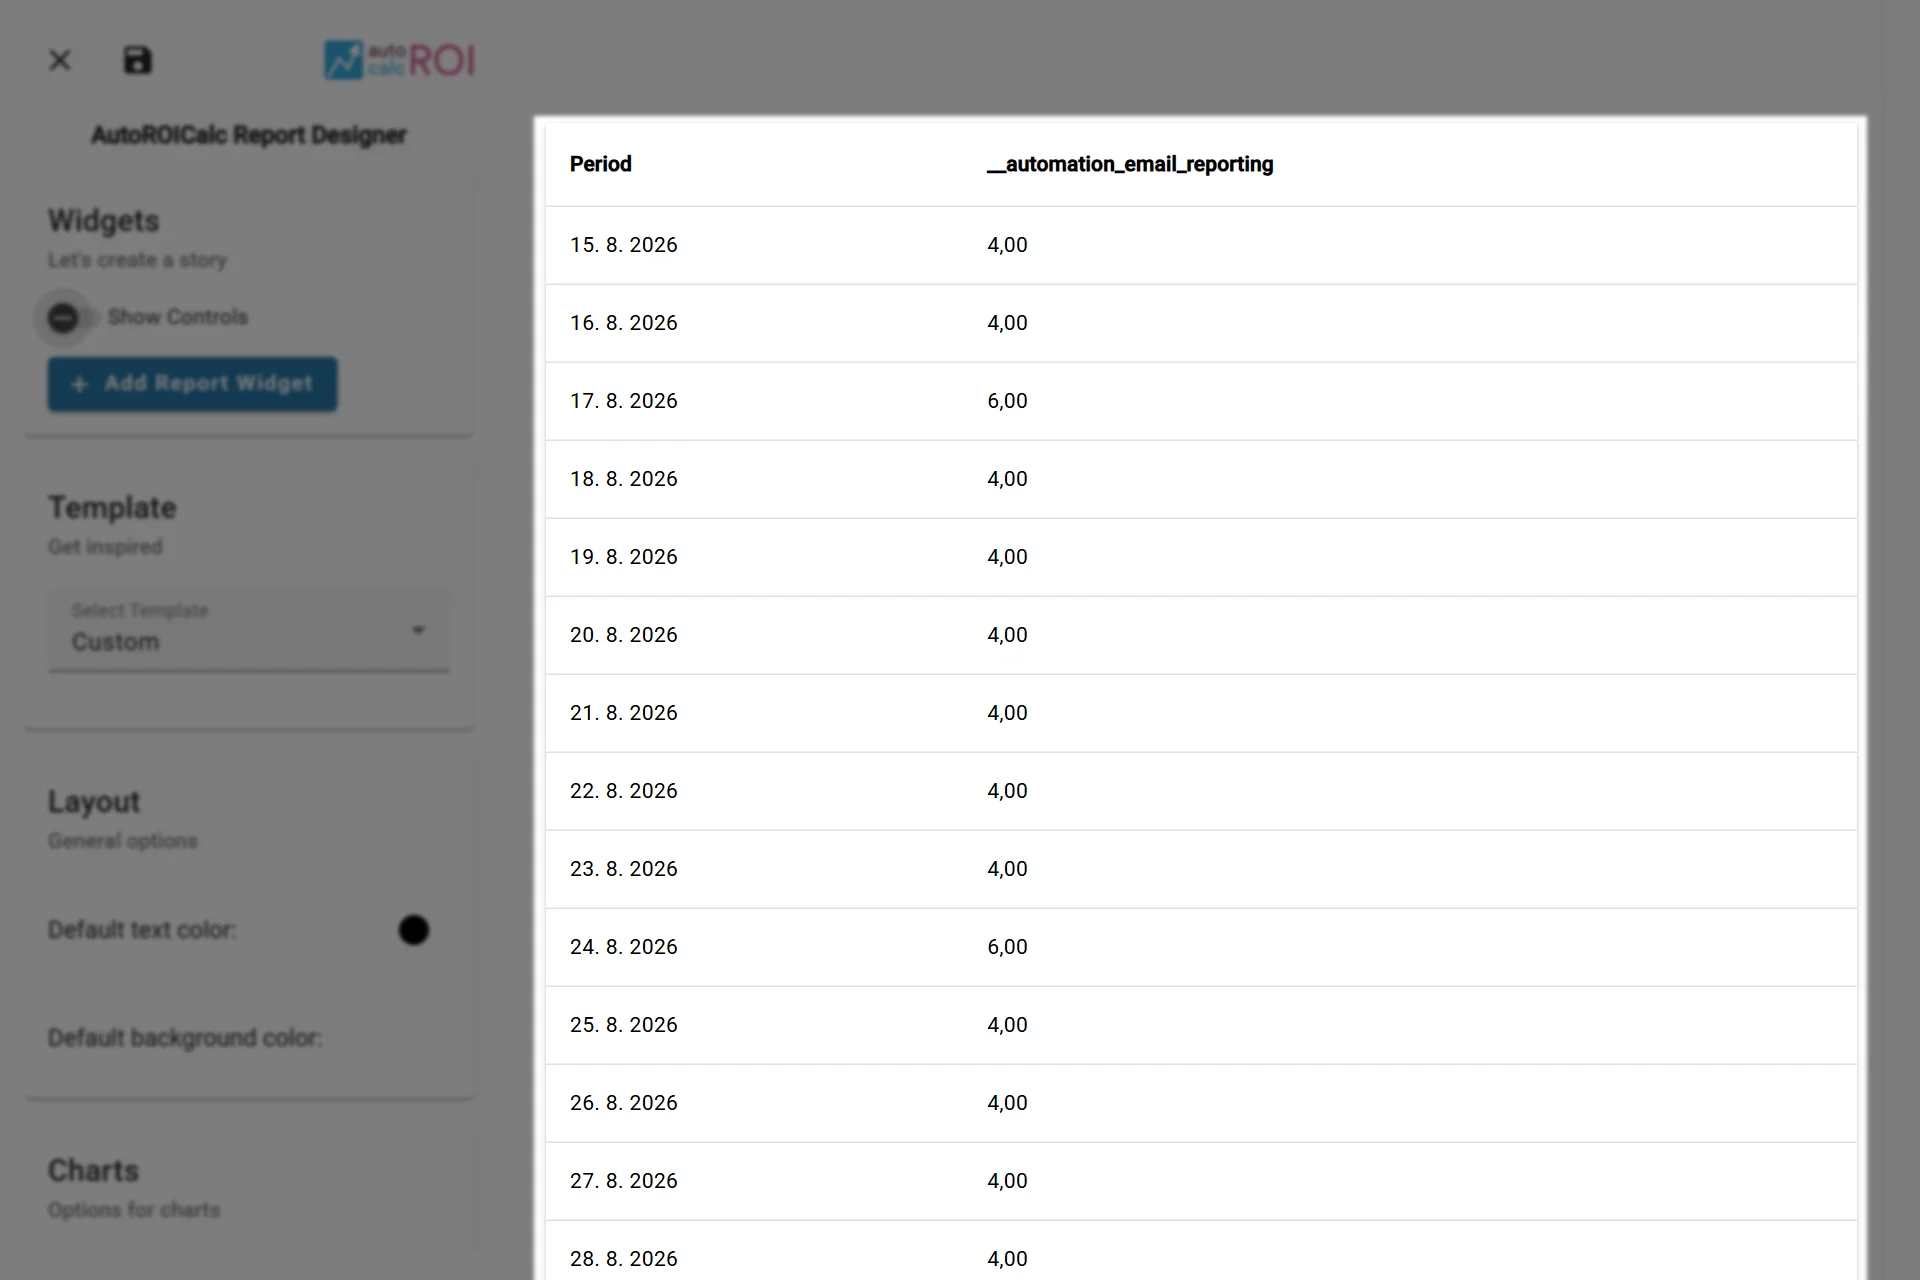
A sample usage of the Data Table Widget