The AutoROICalc Reporting is intended to be used in “real-time” for effective decision-making. But there may be a situation to summarize a certain reported period. Some kind of presentation is useful in this case.
“Fast” export to PDF
In a hurry and need “something” cool on the paper? The Export Report to PDF could help. Currently, a basic template is available, but the User custom branding and fine adjustments are on the roadmap.
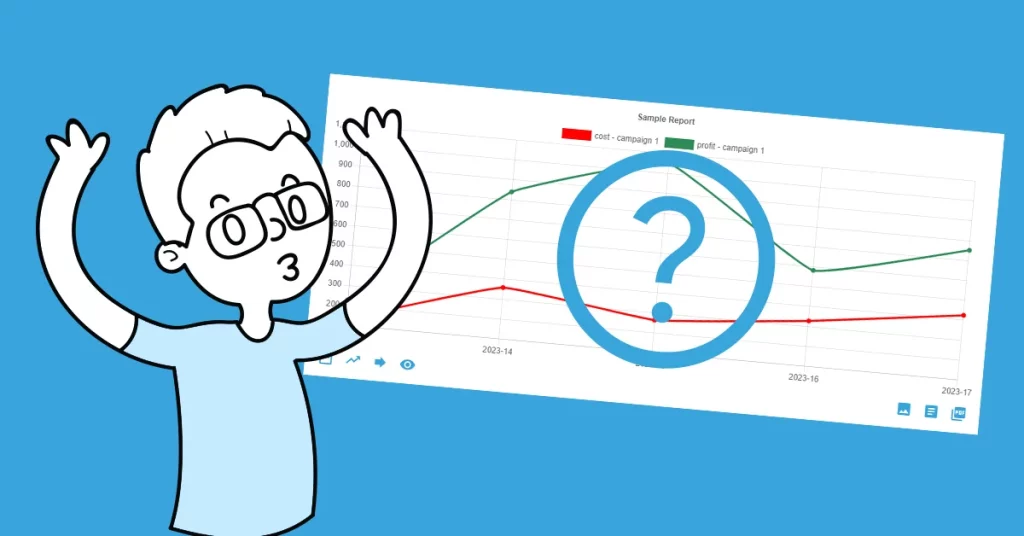
Get the Report chart image as a PNG and the Report Data in CSV
We care a lot about making good presentations. Therefore our task is to make it as easy as possible for you to put your Report data into the presentation. AutoROICalc Reports now allow to download of the chart image as PNG and the data as CSV. The buttons in order to do so are located on the bottom right under the Report Chart image.
We believe users will find these features helpful, allowing them to process the Report data further on their own.
Flexible analytics & reporting without BI complexity
Unify your data, build custom metrics, and automate dashboards and reports — all in one platform.
Unified and Consistent Data Layer
Aggregate and structure data from multiple platforms into one reliable, analytics-ready environment.
Flexible Data Management
Manage your data manually or automatically with powerful tools for synchronization, updates, and transformations.
Accessible Anytime, Anywhere
Your dashboards, reports, and data remain accessible across devices — always under your control.
Custom Analytics & Automated Reporting
Define your own KPIs, build custom dashboards, and automate reporting workflows across your organization.
Set Once, Enjoy Forever!
Start your free 30-day trial and explore all features.
Explore the pricing plans. No credit card is required.