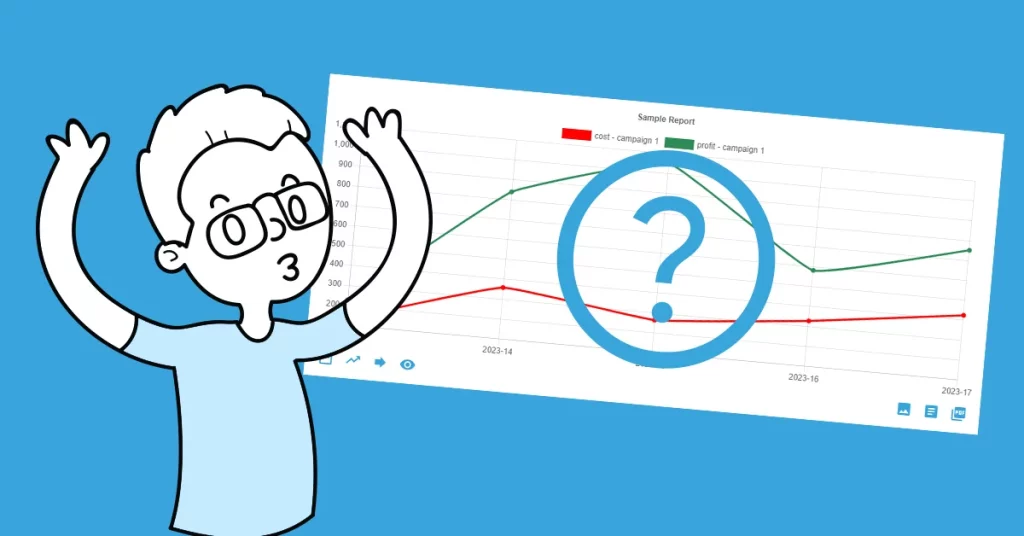
The AutoROICalc Report consists of two main parts, the Report Chart, and the Report Data Table. This can also be spotted at first glance when looking at the Report View.
The Report Chart and Data Table. What else would you need?
You can interact with the Report Chart to get the exact point values or to show or hide some data sets. Utilize Report functions that are located just below the Report Chart. It is possible to adjust the report date range, add trend lines, do data forecasting using available methods, or toggle the Report Data Table. The User can export the Report Chart image also with the Data Table for further processing using external tools, or export the Report to a beautiful PDF using custom templating. It is also possible to share the Report with a public URL.