How to get started? Assuming you went through the Basic Concepts and Best Practices section, you should have an idea of what data to gather and report. If not, please go ahead and:
Create your User Account
To access the Service, you will need your User Account. You can Log In or create a new User Account:
Add your first Records
Get inspired by the records-related tutorials:
- Adding your first Record

- How to import Records from CSV?

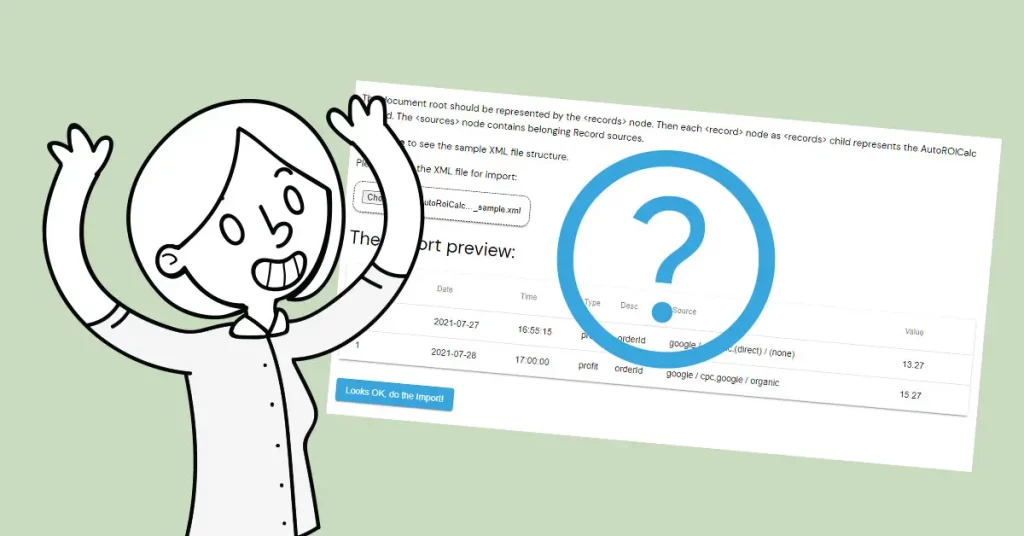
- How to import Records from XML?
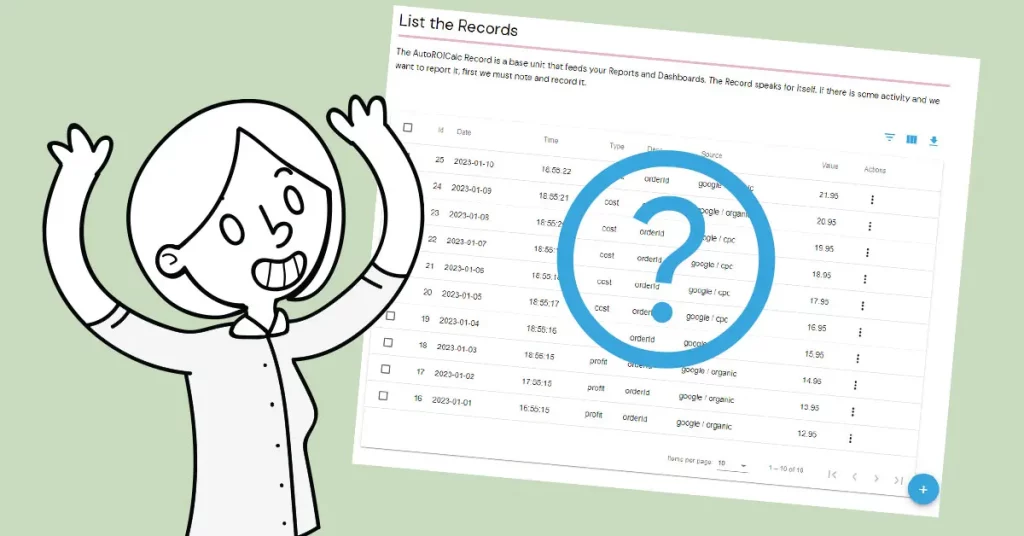
- Managing your Records
- How to manage Records using API: PHP sample code

- How to manage Records using API: JavaScript/Node.js sample code

- How to manage Records using API: Python sample code

Create your first Report
Do it on your own or follow our reports-related tutorials:
- Creating your first Report
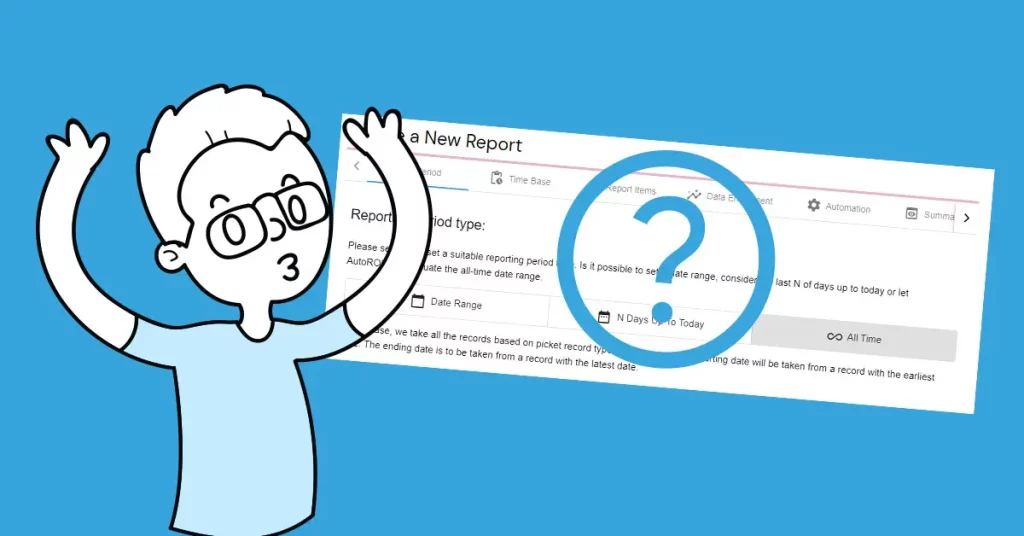
- Selecting the right reporting period type
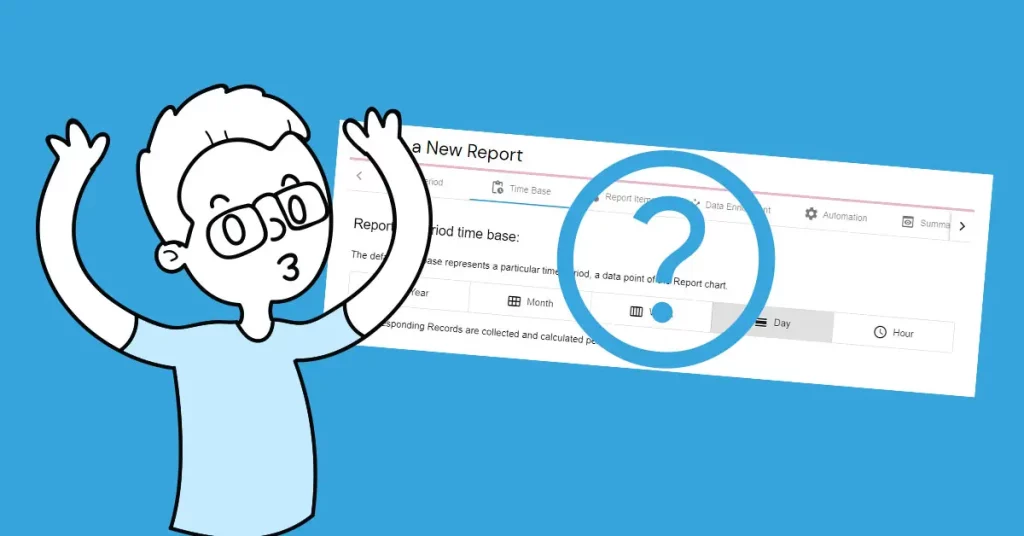
- Selecting the right reporting time base. How does it relate to period type?
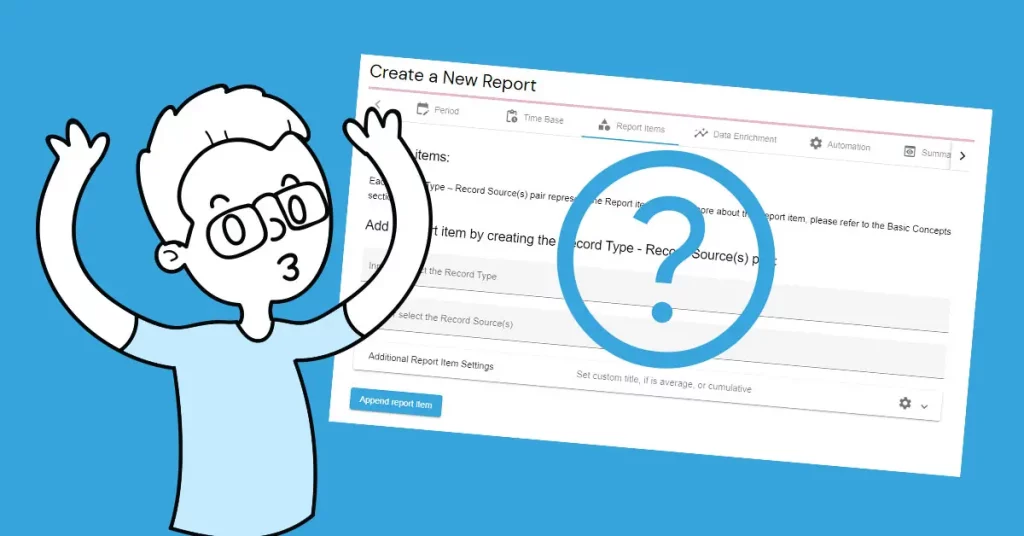
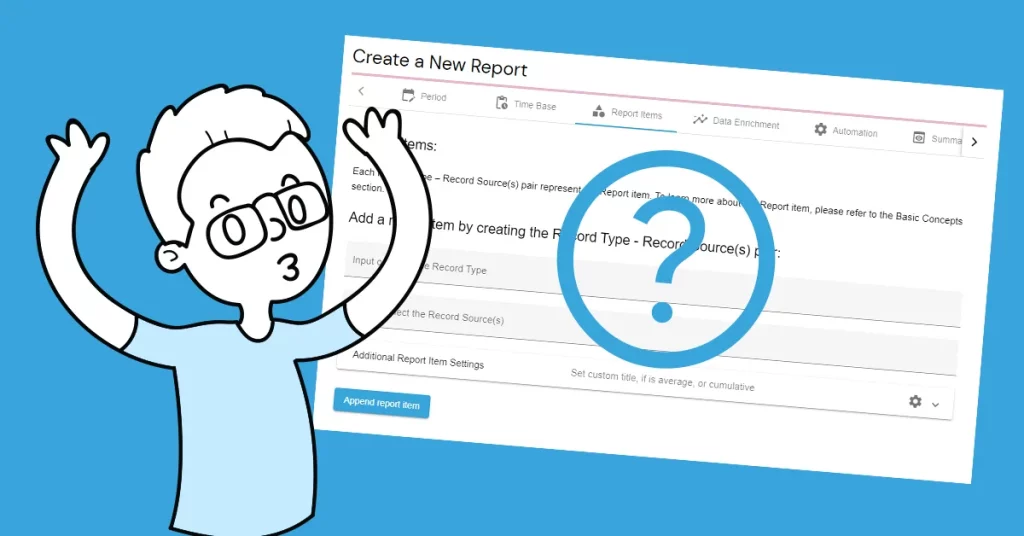
- On Adding the Report Items
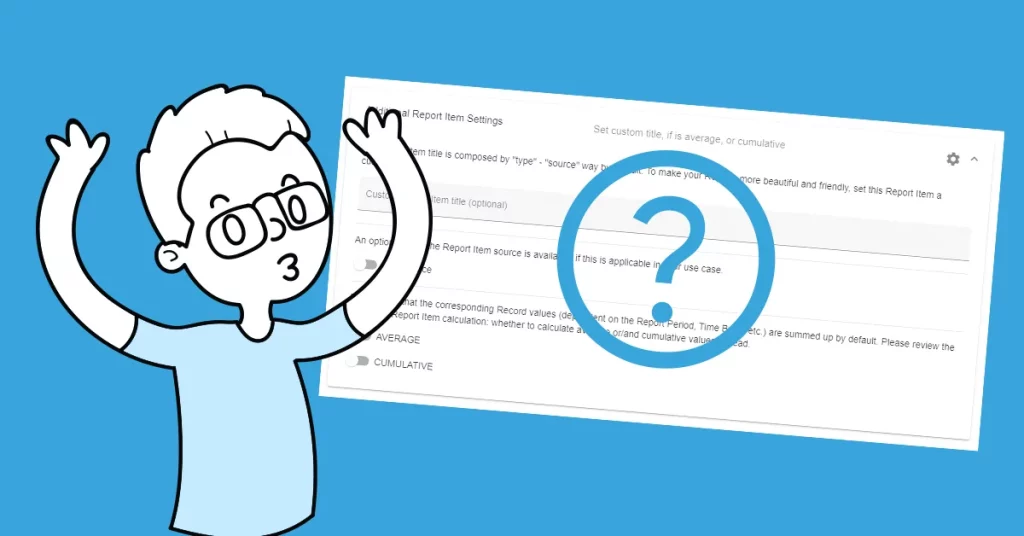
- Additional Report Item Settings
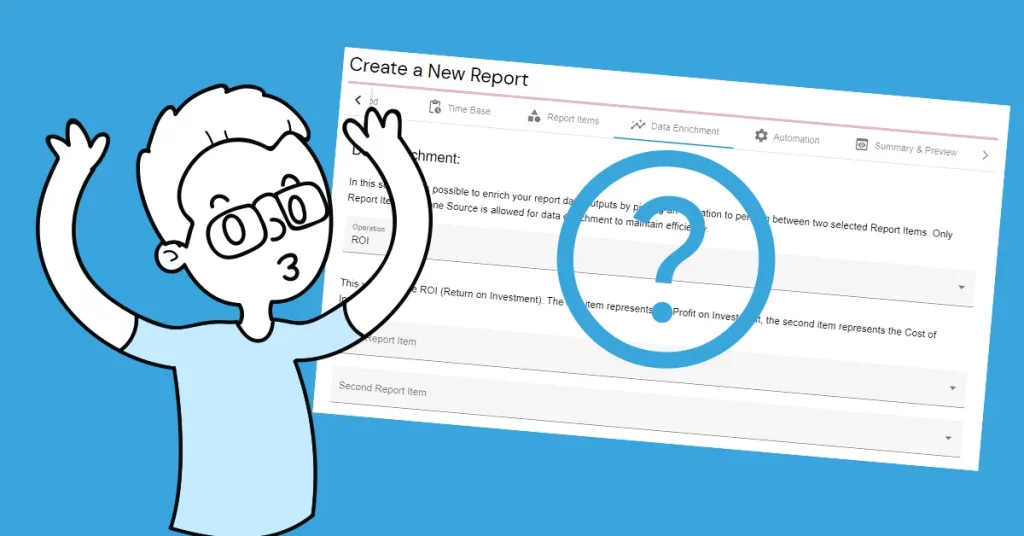
- Data Enrichment
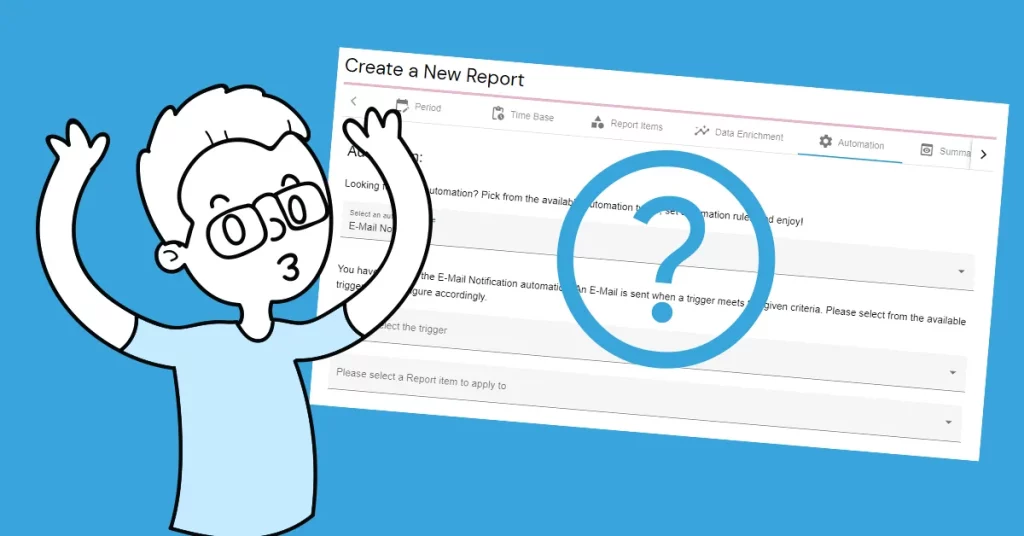
- Report Automation
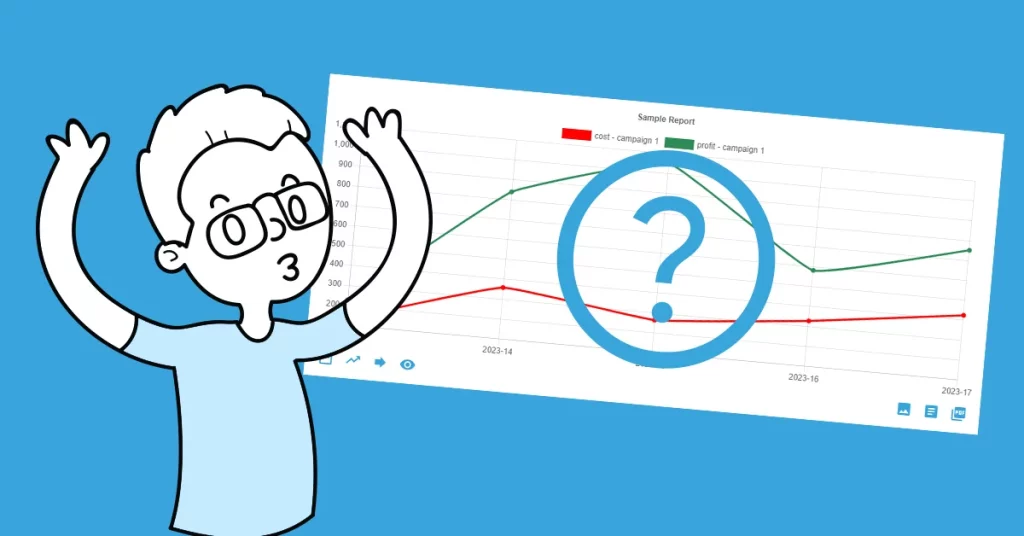
- The Report View anatomy explained
Explore, Enjoy, Share
Have you found it useful so far? Wonderful! Discover all the Features to have more joy and start sharing your Reports to keep your activities on track with those who care.