The best practices guide our users to focus on what matters. Simplicity is a key. We are here to help you immediately see how your activities are going.

What
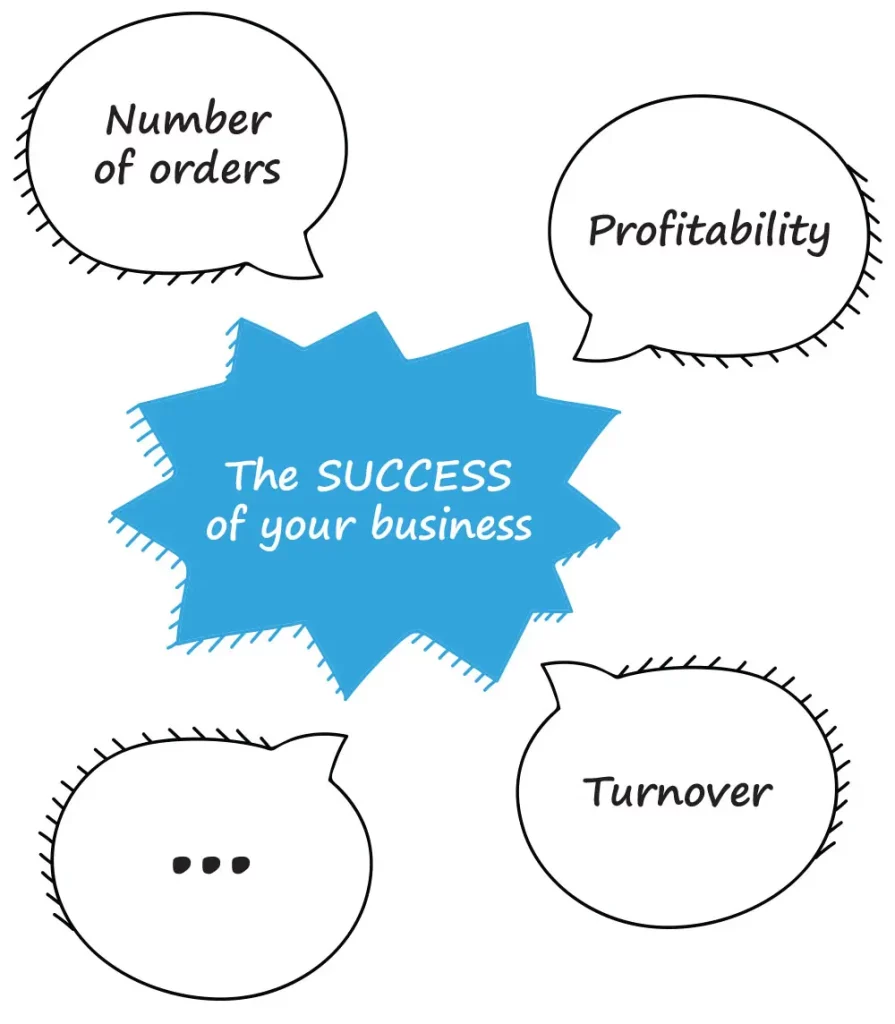
At the very beginning, it is vital to know what data to gather and report. In case you are not sure or not clear about it, take a look at your business model. Take a look at the items that are contributing to your business success.
Maybe the first item you will have in mind would be the net profit. And that´s okay. You can go deeper. Which are the items that are contributing to the net profit? For demonstration purposes, here are some examples:
- Number of banner impressions.
- Number of customers taking an action.
- Number of orders.
- Average order value.
- Turnover.
- Profitability.
- Hours worked.
So, what are the items that are contributing to your business success? You can go even deeper also with the items above, listed as the demonstration. But it has a lot to do with your business model. Take some time to think about this and then go on with your items.

How
How will you gather the items data? Manually (go to Add a Single Record section), or is it possible to do it in an automated manner (take look at the API)? But in this part, the AutoROICalc Records are the most important. Per each item, you should be able to provide the required Record entries, such as date and time, record type, description, record source, and record value. These entries are obvious: Date and Time, Description, and Record Value.
These are the tricky entries: Record Type and Record Source (or multiple Sources).
The Record Type and Record Source form an important base for your Reports. Since there are no boundaries to what can or cannot be the Record Type or Source, the decision is on you by the end.
Record Types
To have an idea of where to begin, your Record Types could follow the items that are contributing to your business success as described in the “What?” part. For example, one of your Record Types could be “Number of orders” or “Net profit per order”.
Record Sources
There can be only one or multiple Record Sources. We can understand the Record Source as something that caused the item or from where the item comes from. For example, in the case of the “Number of banner impressions” item, here are possible sources: Some Google Ads campaign, Organic post on Facebook, or E-mail newsletter.
We hope you have an idea now. The structure or “look” of your AutoROICalc Records depends on your business model and the items contributing to your success. Just define them in your own way to make them serve as effectively as possible for your reporting purposes.
Reports and Dashboards
With the Report, you should see the development of your activities. It is recommended to set only related items per Report. For example, you would track items as “Number of orders”, “Order revenue”, “Average order value”, “Order profit” within one Report. You would rather not mix items that are not related to each other. Also, be aware of a number of items to avoid the Report being confusing.
Sometimes the best practice is to configure one item with various sources. As an example, the item would be “Number of orders” with the following sources: “Facebook campaign 1”, “Google Ads campaign 1”, etc. Then include these related Reports into a single Dashboard in a meaningful order.
Declining, stagnant, rising
What do your Report charts look like? Are they declining, stagnant, or rising? Of course, the rising charts are the best and also wanted scenario. There are simple rules for all three states:
- Declining. This means that something is not working. Change or improve the item activity. For example, if the “Number of orders” item is declining, you would make more effort to get a greater number of orders, which includes changing or improving relative items, e.g. “Number of banner impressions”.
- Stagnant. Focus on what contributes to the positive development and improve it. Eliminate losses. Do not break items that work.
- Rising. Do nothing if you are satisfied. Continue as usual. Otherwise, proceed as in a Stagnant state.

We believe you have an idea about the AutoROICalc best practices now. There is always a chance (and the best way at the same time) to find out or develop your own best practices. We keep our fingers crossed for this. Please don´t hesitate to take a look into Documentation or contact Support in case you need assistance.