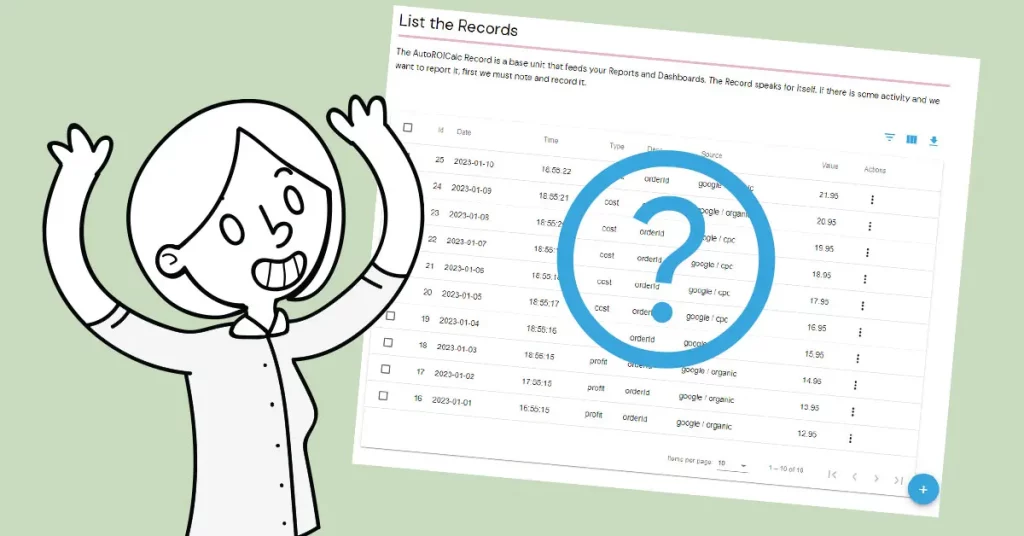
It’s always good to know the amount of web traffic you get for a certain time frame. Is it also that important to know where the traffic comes from? Definitely! Why? It is so powerful for many reasons but mainly to know if a particular campaign is successful, whether some of the web traffic sources are a waste of time, or if there’s more space for improvement for the top ones.
To have the whole is great. To know what it is made of is – WONDERFUL!
Having success makes us happy. But still, it is much better to know what the cause is. You can set up as many detailed reports as you wish. But to stay healthy – sometimes it is a better idea to have a few meaningful reports with the “wholes” and use an option to see the sources (causes) distribution. See a shiny example below.

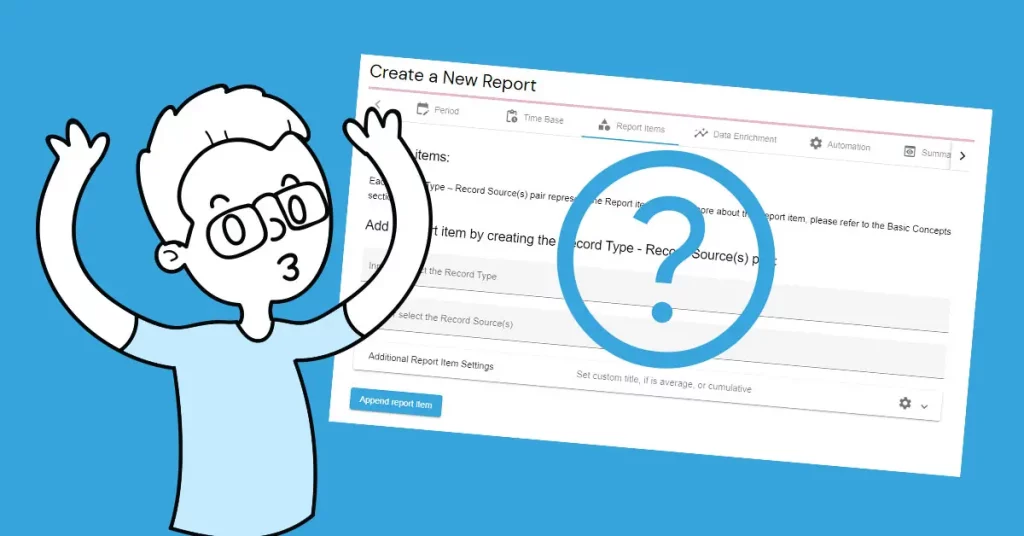
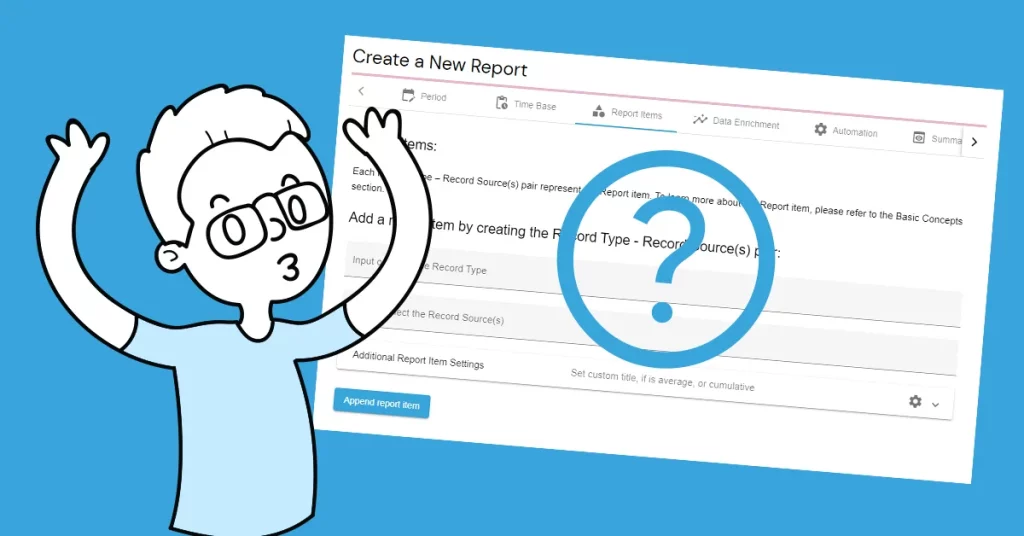
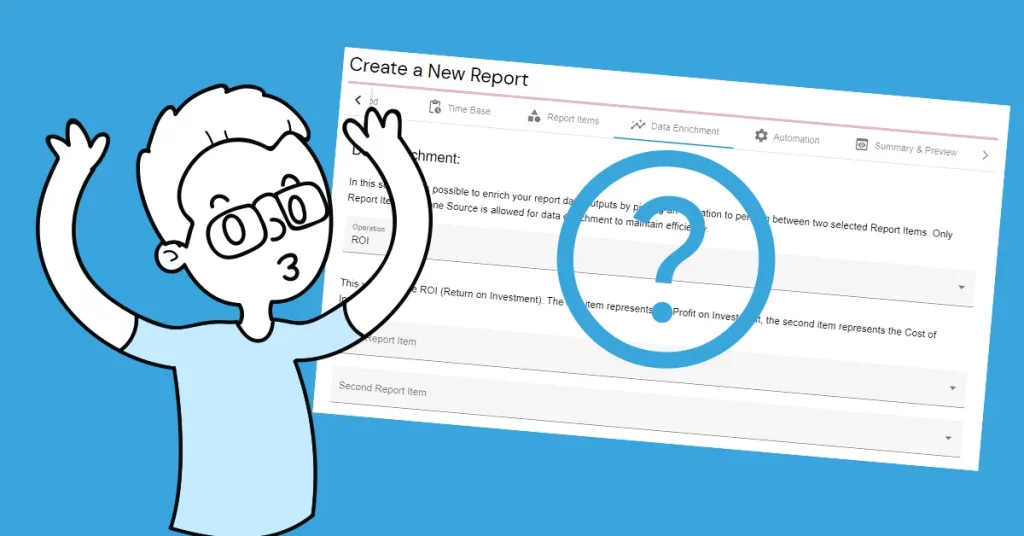
How to do the magic?
We believe it should be simple! Just look for the “Show Sources Distribution” button in your Report view:

Need help with setting up your new ROI journey?
If you are not sure where or how to start, we are always here for you. Just reach us at support@autoroicalc.com.
Flexible analytics & reporting without BI complexity
Unify your data, build custom metrics, and automate dashboards and reports — all in one platform.
Unified and Consistent Data Layer
Aggregate and structure data from multiple platforms into one reliable, analytics-ready environment.
Flexible Data Management
Manage your data manually or automatically with powerful tools for synchronization, updates, and transformations.
Accessible Anytime, Anywhere
Your dashboards, reports, and data remain accessible across devices — always under your control.
Custom Analytics & Automated Reporting
Define your own KPIs, build custom dashboards, and automate reporting workflows across your organization.
Set Once, Enjoy Forever!
Start your free 30-day trial and explore all features.
Explore the pricing plans. No credit card is required.