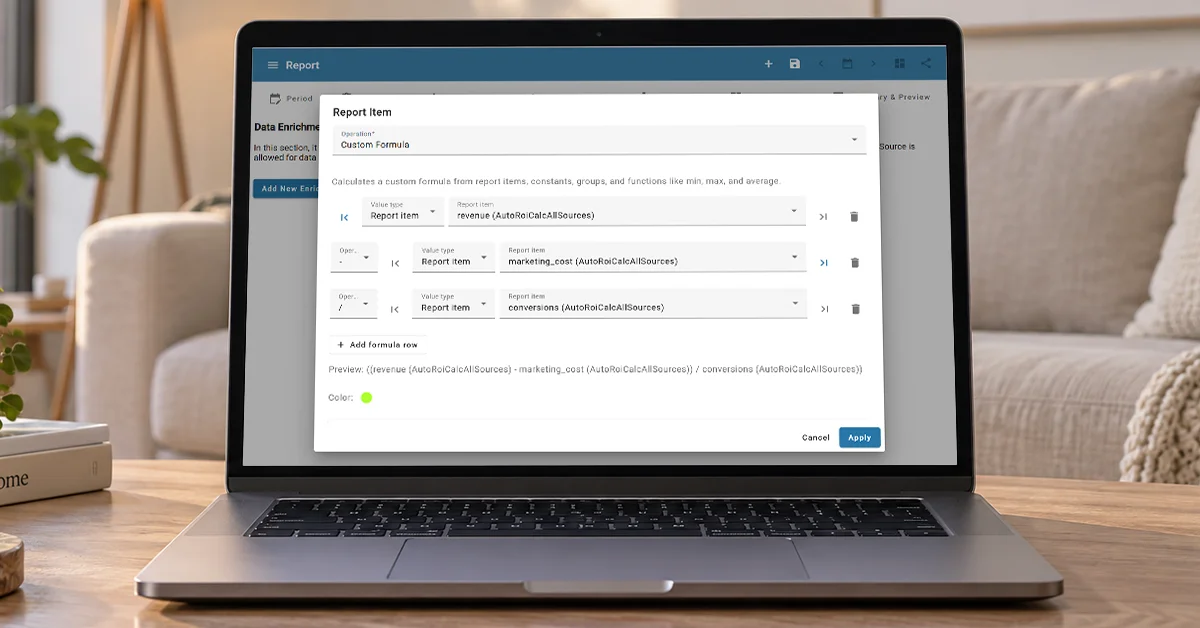
Costs, revenue, and conversions are useful on their own. A custom metric can answer a more specific question: how much return remains per conversion after marketing cost? AutoROICalc report enrichment can combine multiple report items in one formula.
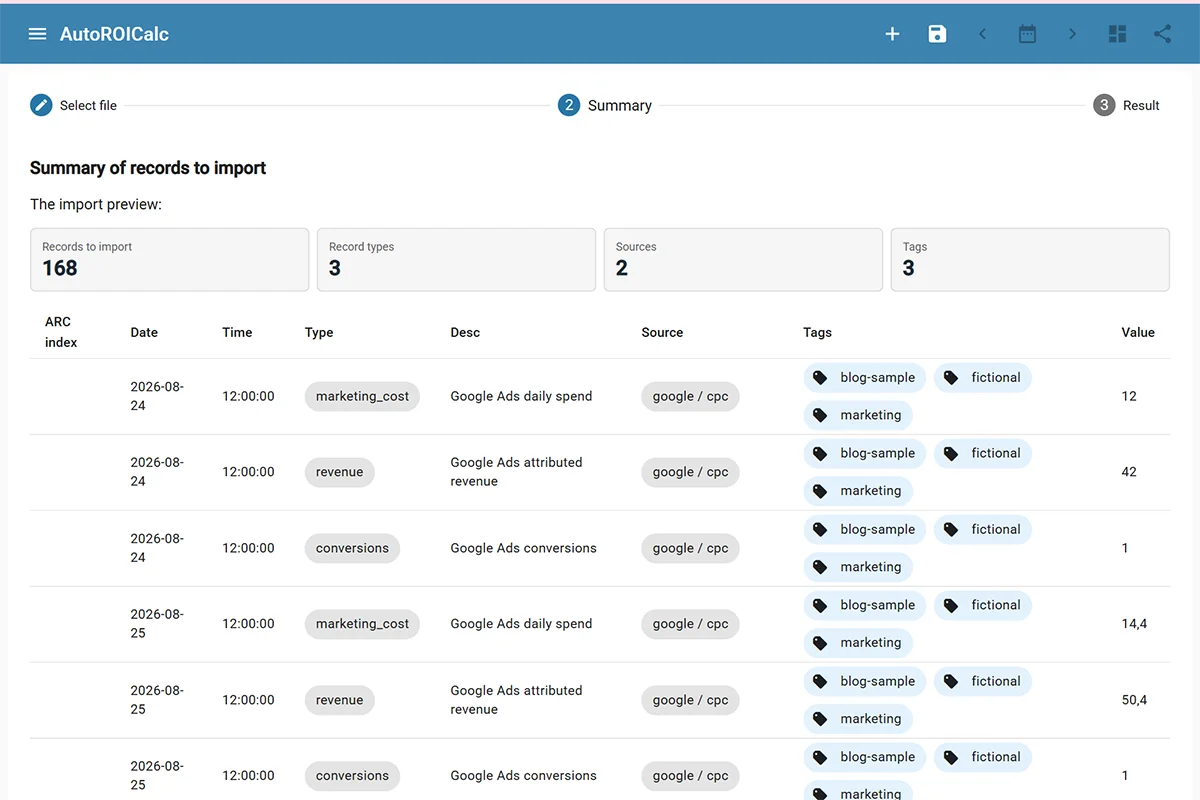
This walkthrough uses the same fictional data as our marketing dashboard tutorial. Download the sample ARC records, import them through Records → Import from ARC, and select the fixed period 24 August–20 September 2026 and a weekly time base when building the report.
Start with three report items
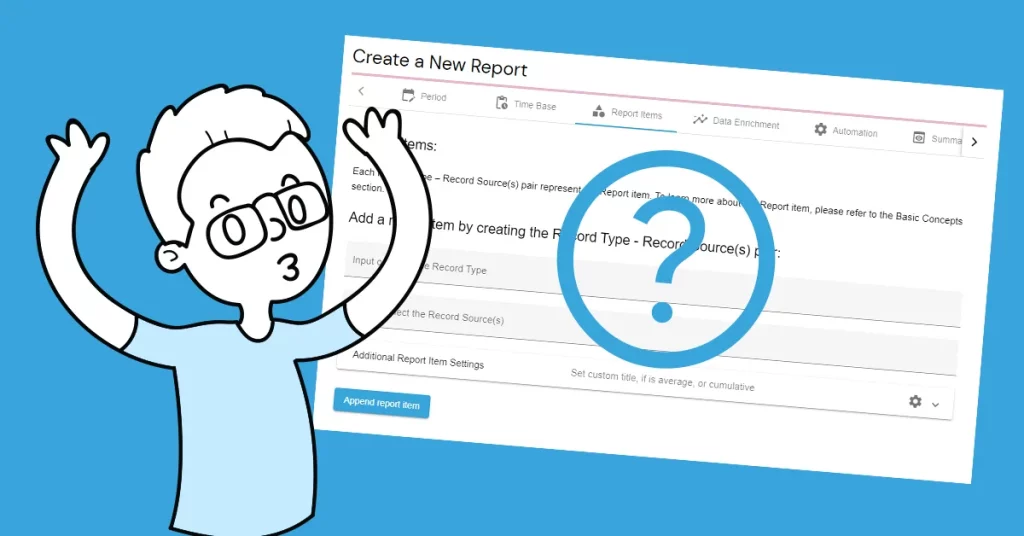
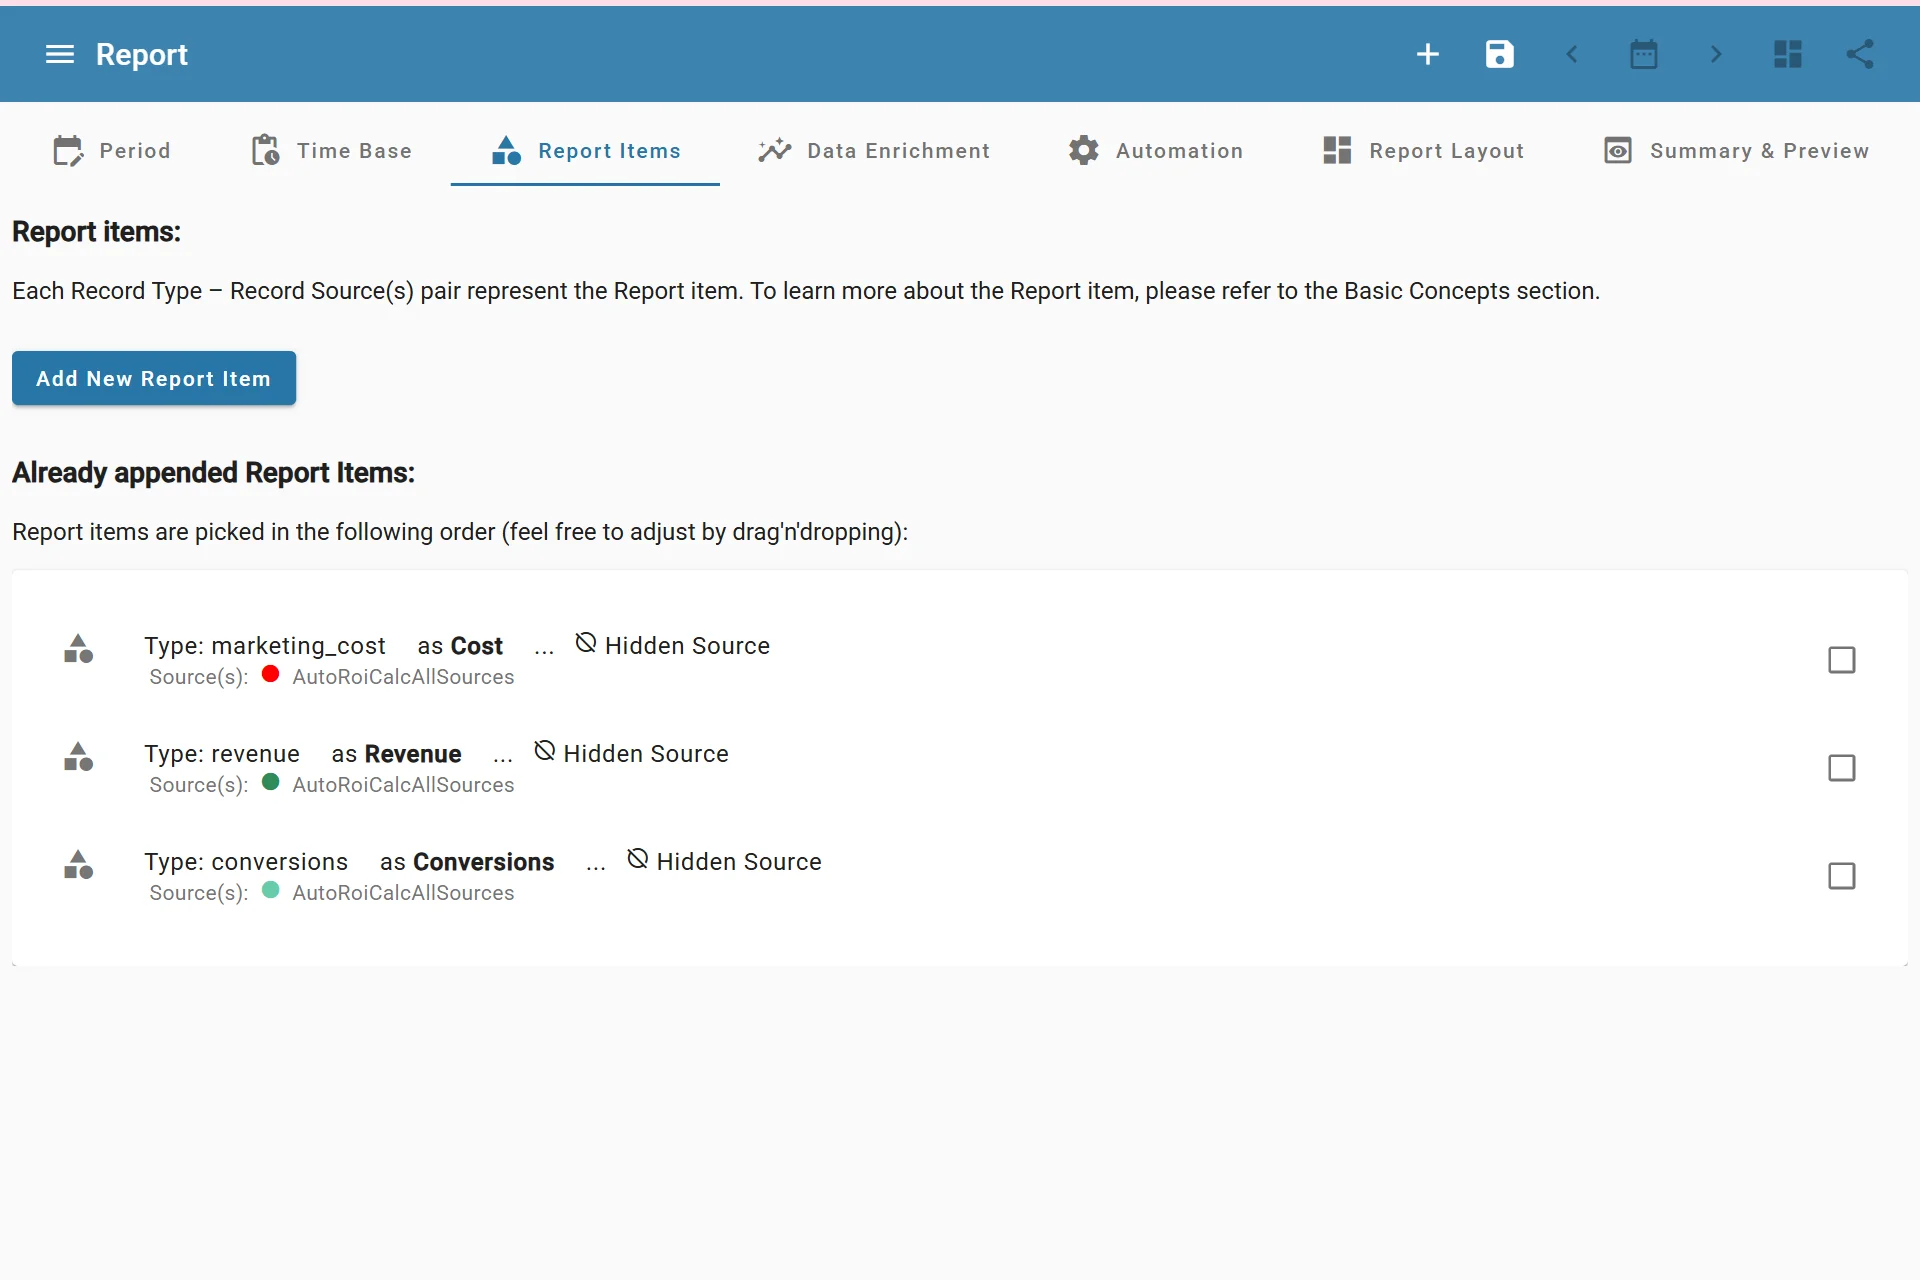
Add report items for the marketing_cost, revenue, and conversions record types. Include both sample sources, Google Ads and email, for an overall result. Give each item a clear display name so you can recognize it in the formula editor.
For the complete sample period, the totals should be:
| Report item | Total |
|---|---|
| Marketing cost | 760 |
| Revenue | 3 120 |
| Conversions | 52 |
If these values differ, check the report period and sources before adding a calculation.
Create the custom metric
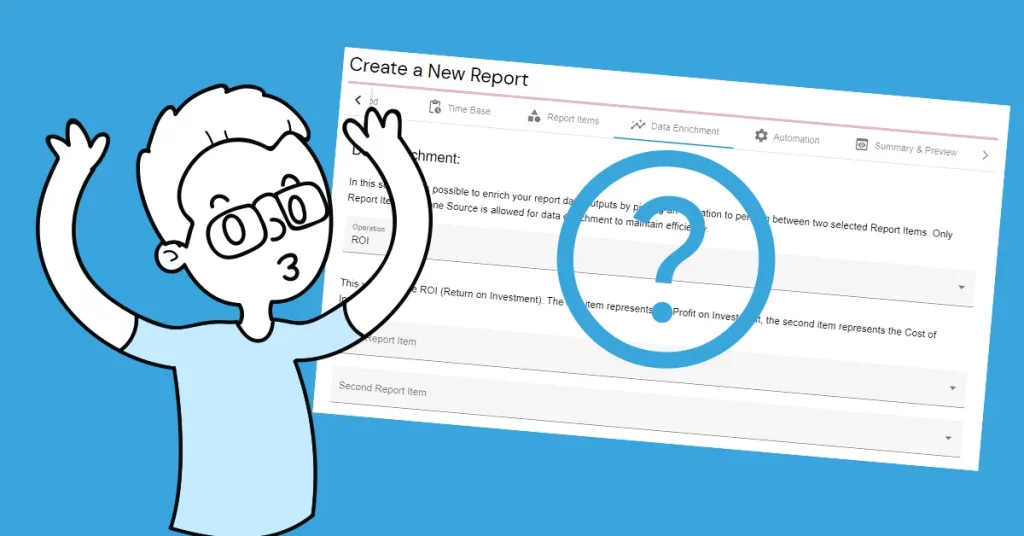
In Data Enrichment, choose Custom Formula and use the report item picker to build this calculation:
(Revenue − Marketing cost) ÷ Conversions
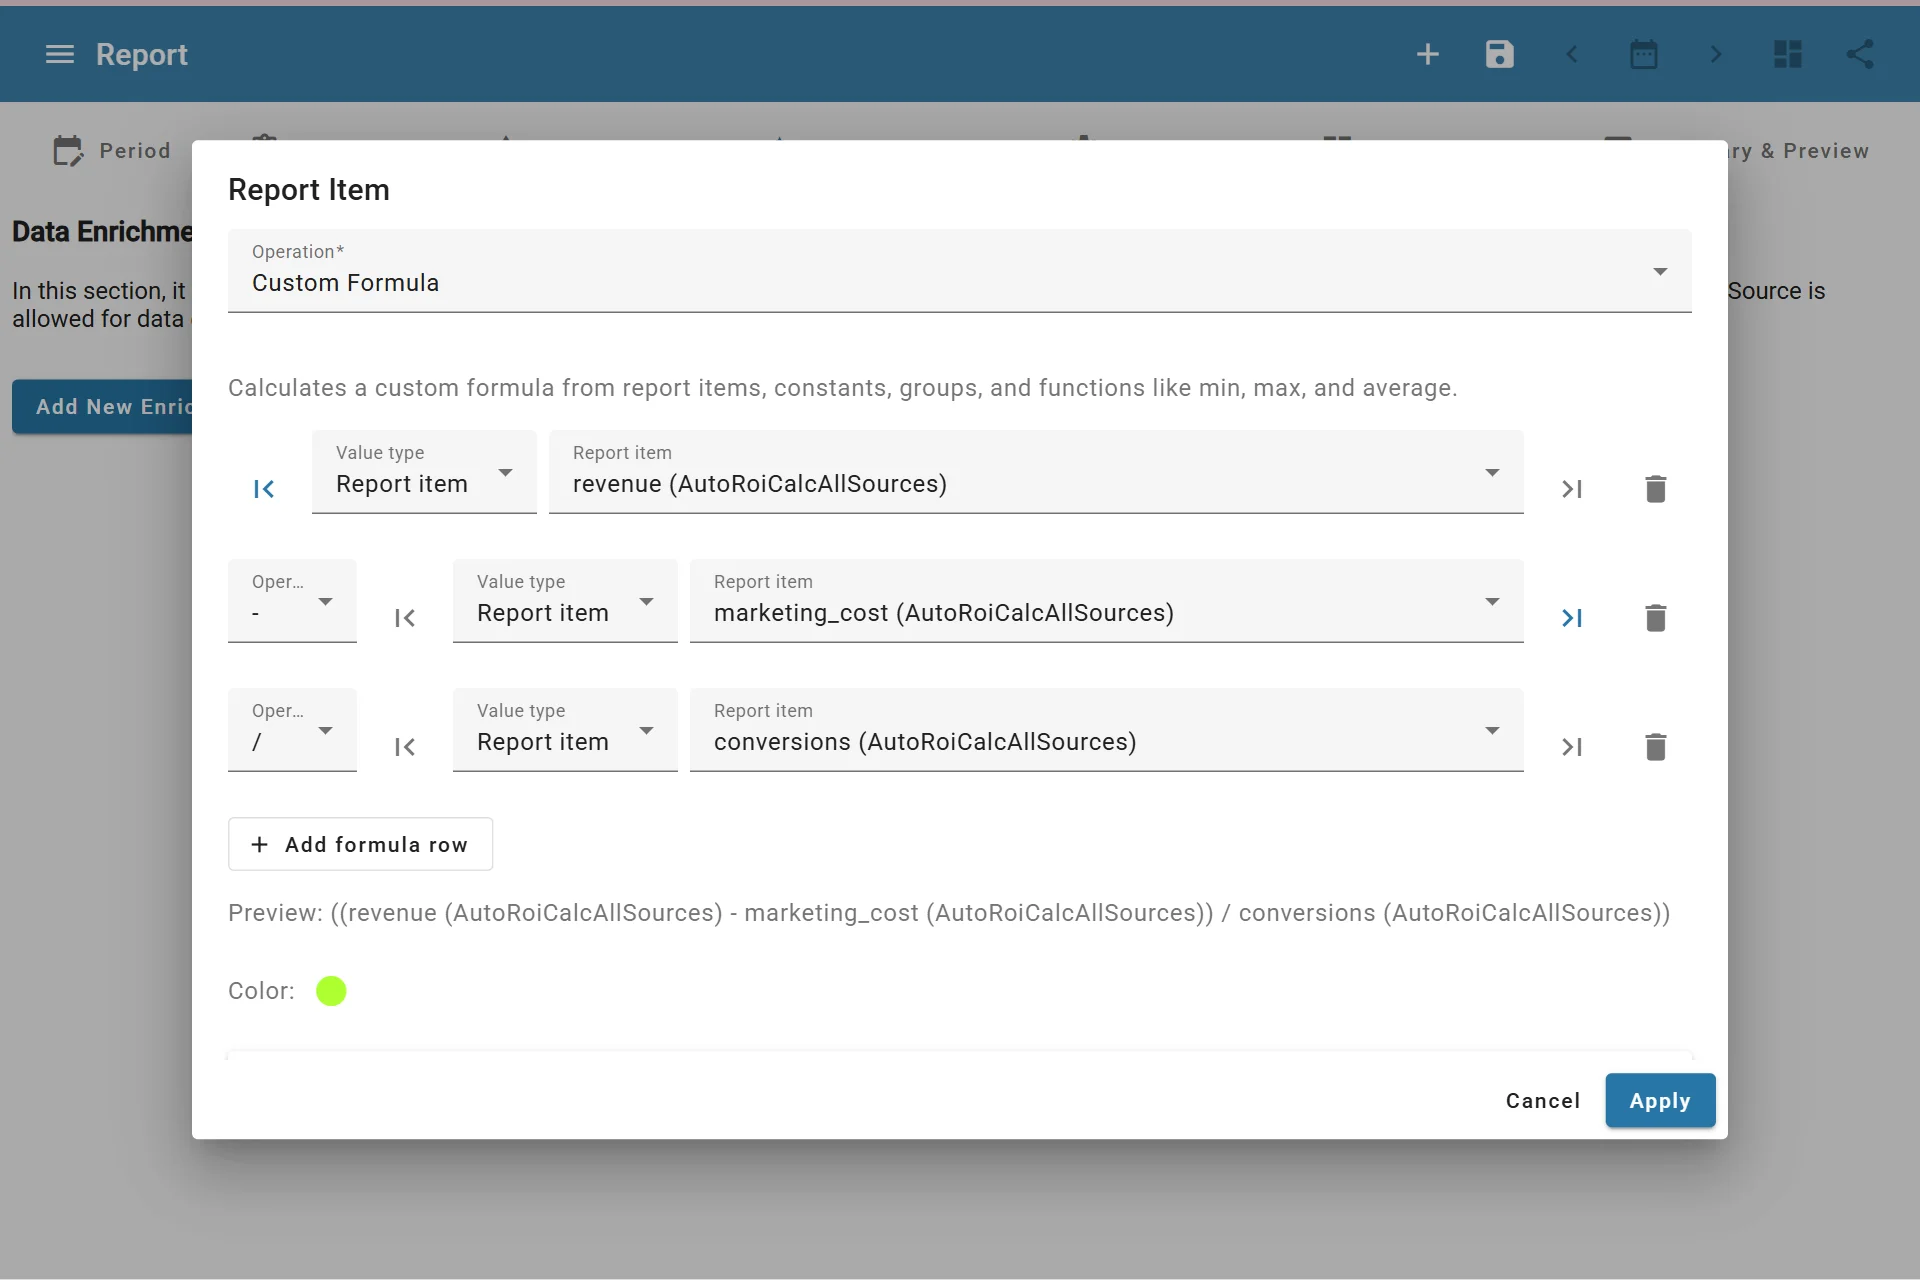
With the sample totals, the net return is 3,120 − 760 = 2,360. Dividing by 52 conversions gives 45.38 per conversion, rounded to two decimals. Name the enrichment item “Net return per conversion” and set its rounding to two decimal places.
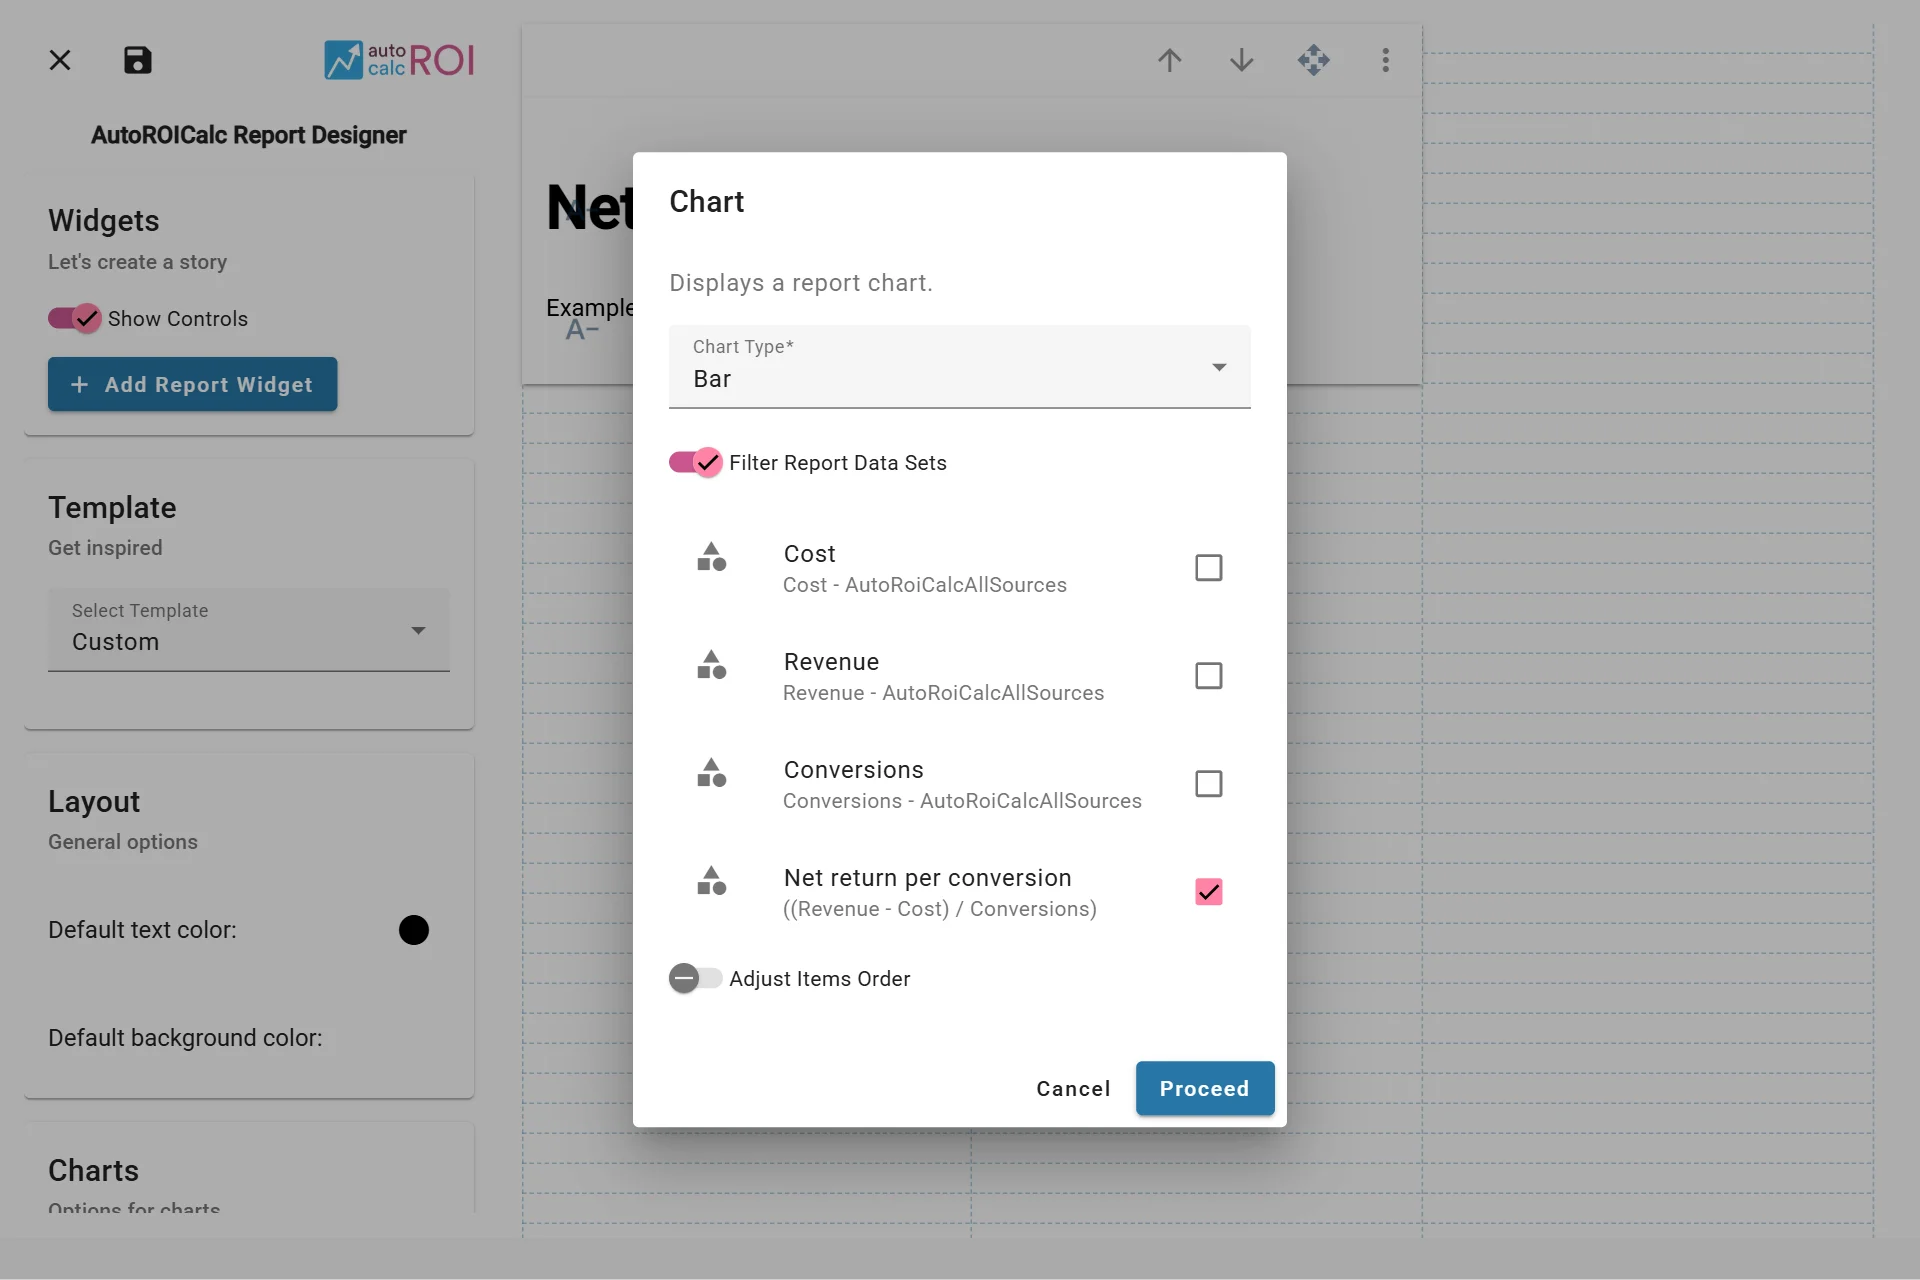
The formula is a teaching example, not an accounting measure of profit: it subtracts the marketing cost represented in these records. If you also need product, fulfillment, or service costs, add those as report items and include them in your own formula. A zero-conversion period also needs careful interpretation; inspect the report’s result before sharing it.
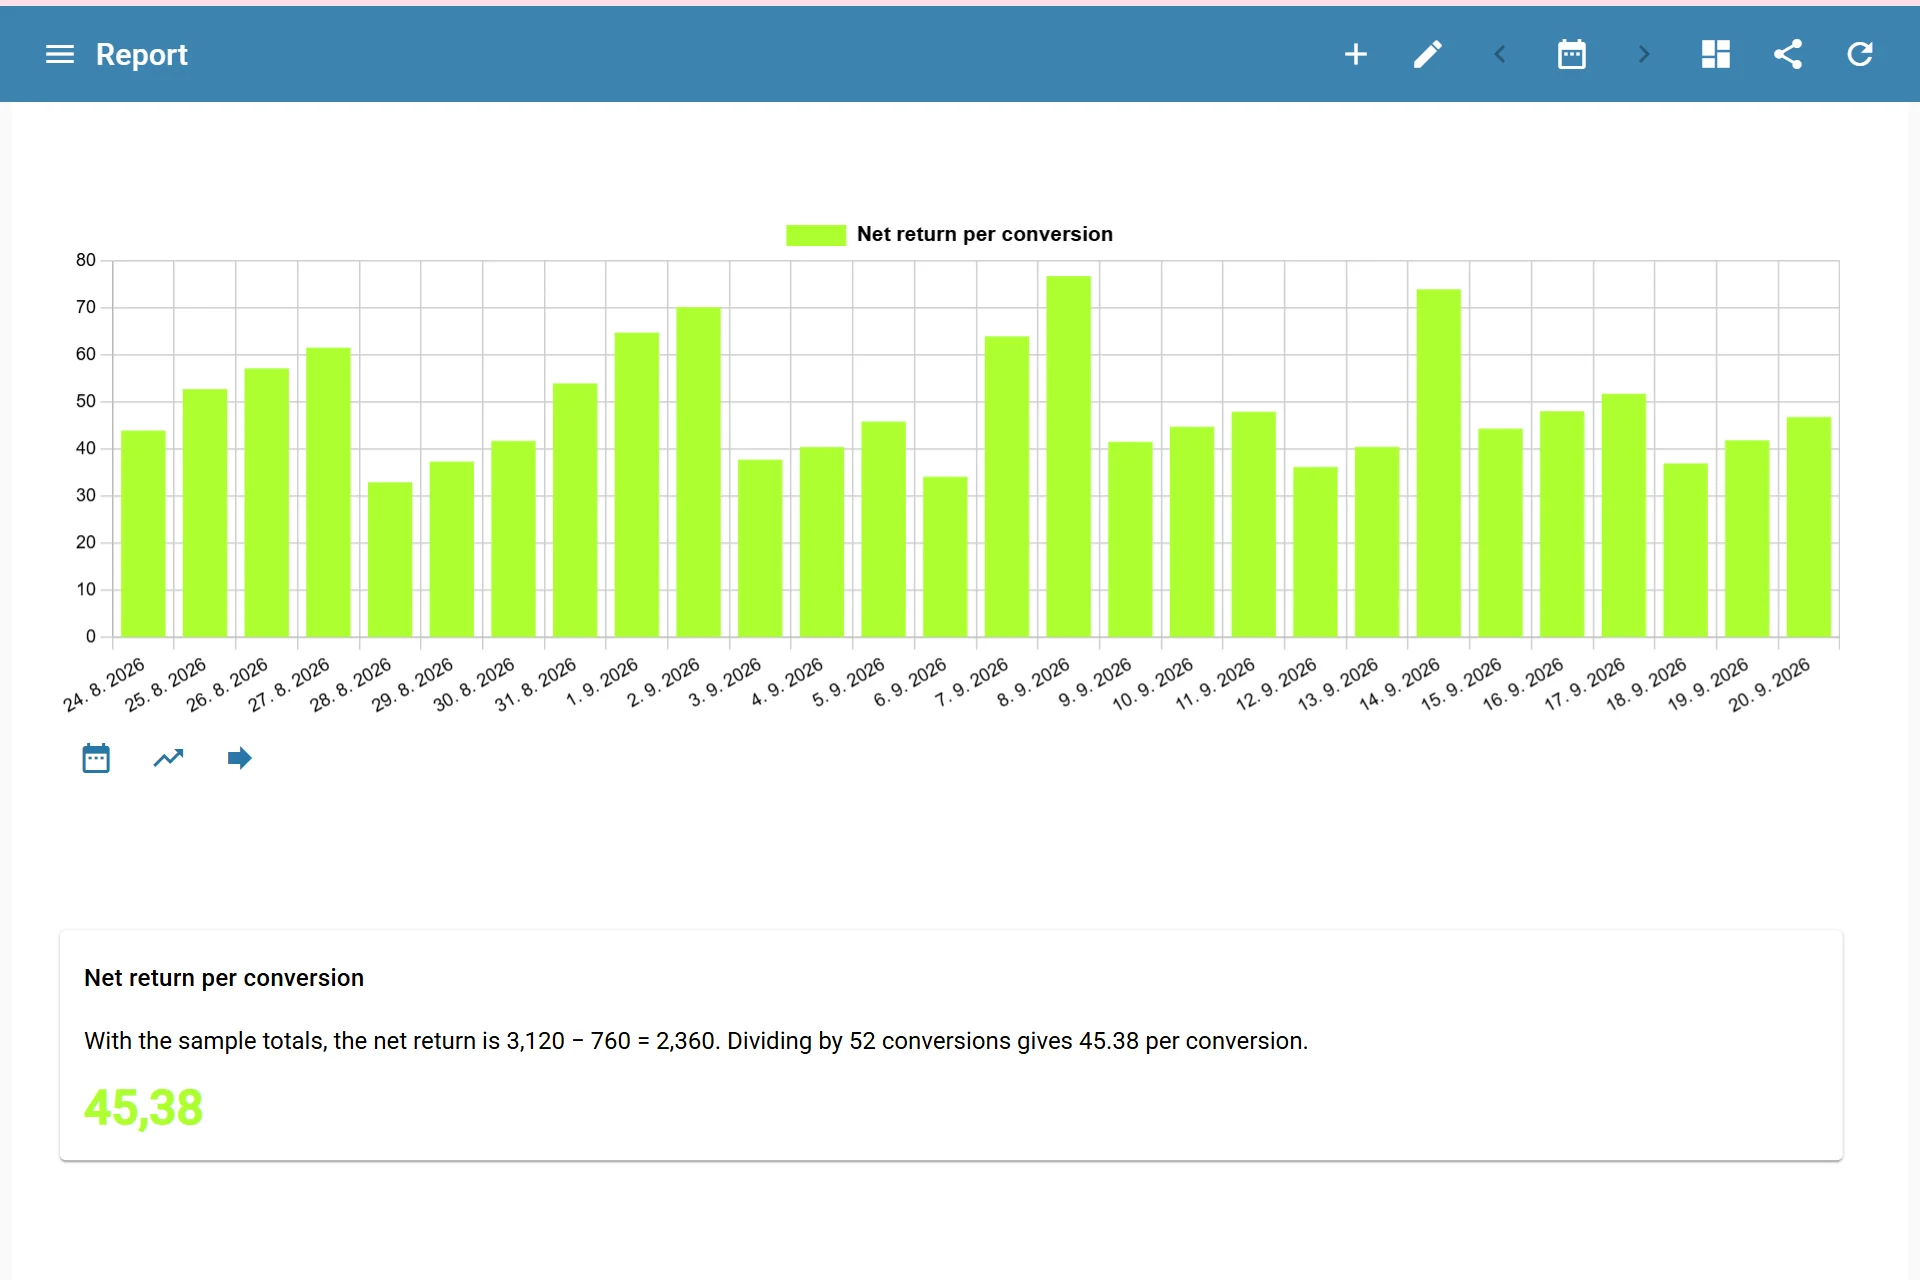
Add context beside the number
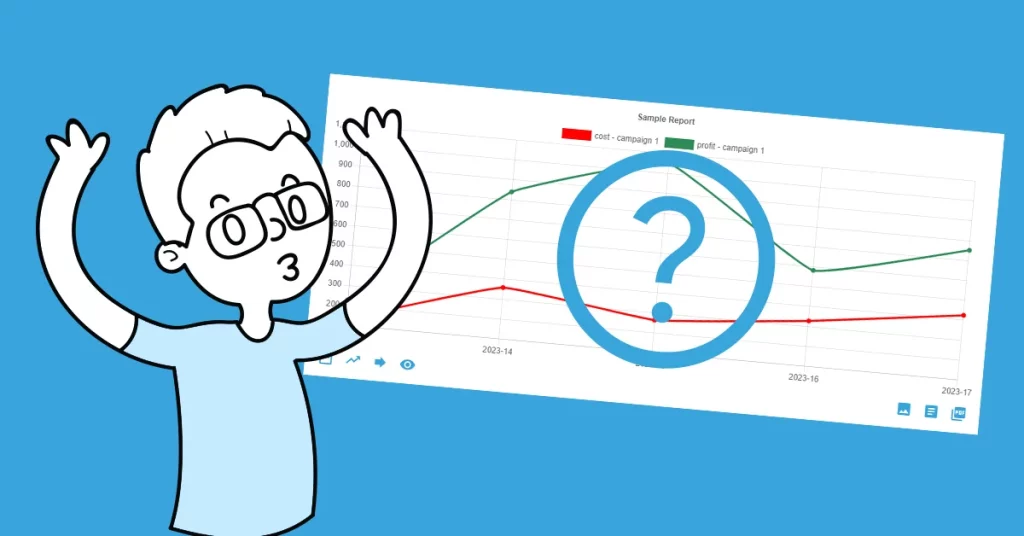
A single figure can hide changes in volume. Place the new metric beside revenue, marketing cost, and conversions in the report, then add a chart or data table by week. You can also compare the sources separately to see whether a change comes from Google Ads or email.
The sample records include country, device, product, and campaign breakdowns. Add a Breakdown widget when you want to inspect those details, or a Map widget for revenue by country. Save the report and add it to a dashboard for recurring review.
For the available operations and formula functions, see Report Data Enrichment. The Records API guide explains how structured breakdowns are stored in custom data.