
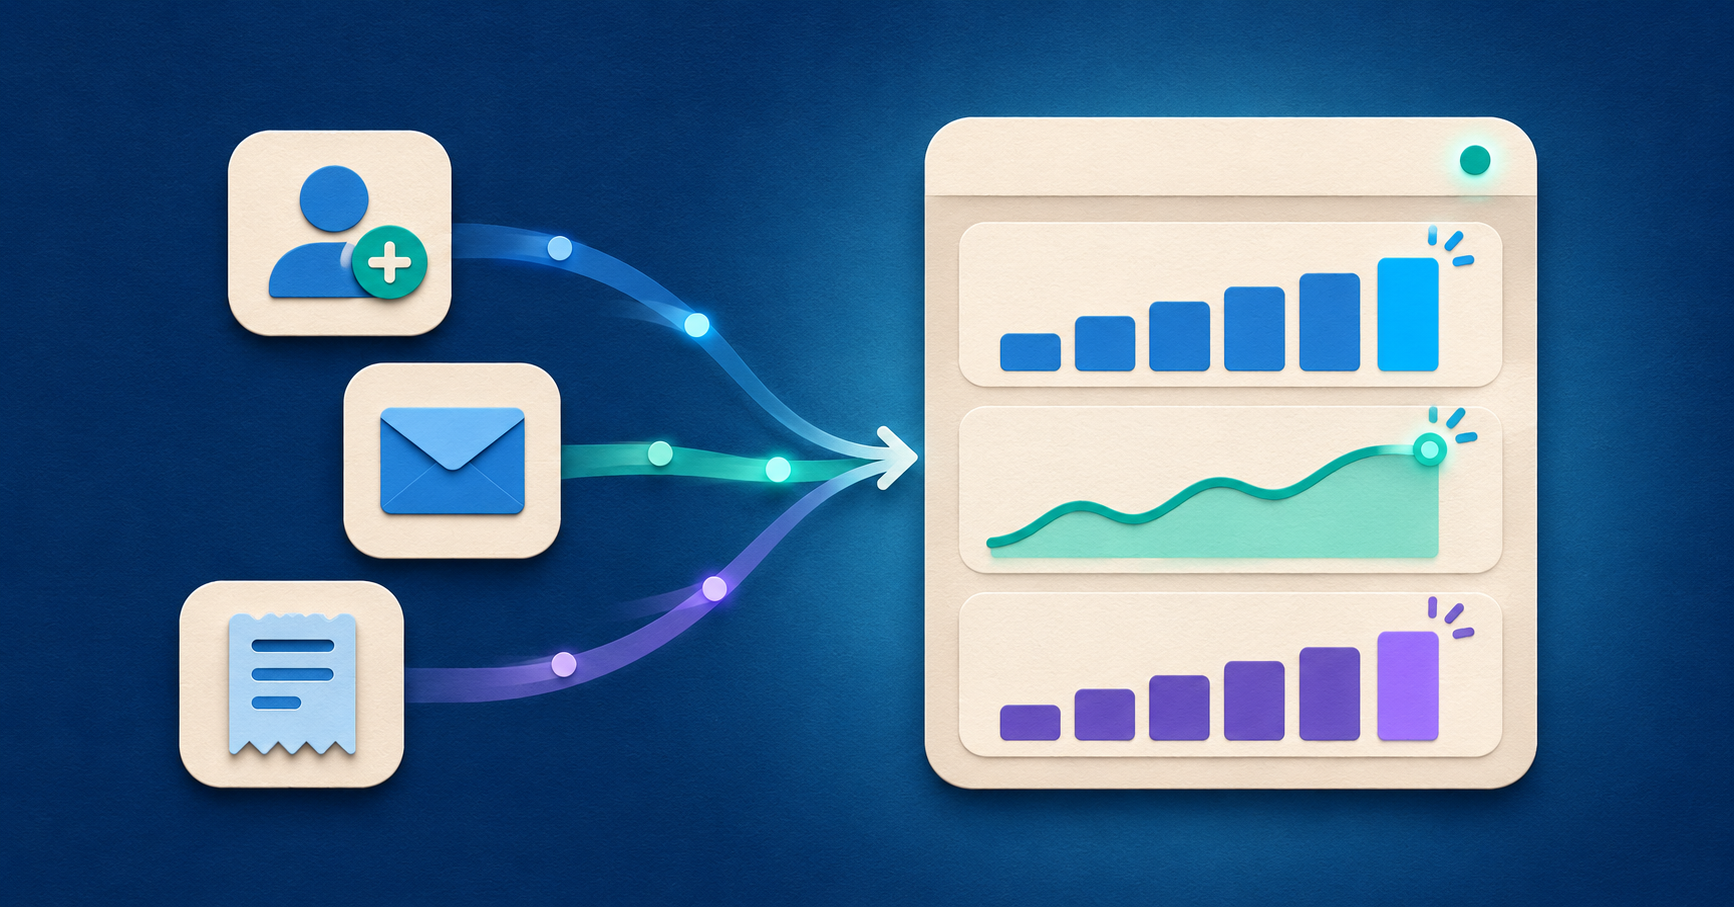
When a campaign goes live, you might want to see whether signups are coming in, how many came from the launch email, and how much people have paid so far. A real-time report brings those answers together while the campaign is still running.
In AutoROICalc, you can report on anything you can capture as a timestamped record. A signup, a paid order, a support ticket, and a completed job are all measurable events. You choose which ones to send and what each record represents.
A launch monitor in practice
Imagine a team announcing a new product by email while the landing page is also getting signups from direct visits and partner referrals. Their launch monitor has three Real-time widgets, each looking at the last 30 minutes.
- All signups counts signup records from every source.
- Newsletter signups counts the same kind of record, filtered to the newsletter source.
- Paid order value sums the amounts recorded for paid orders in euros.
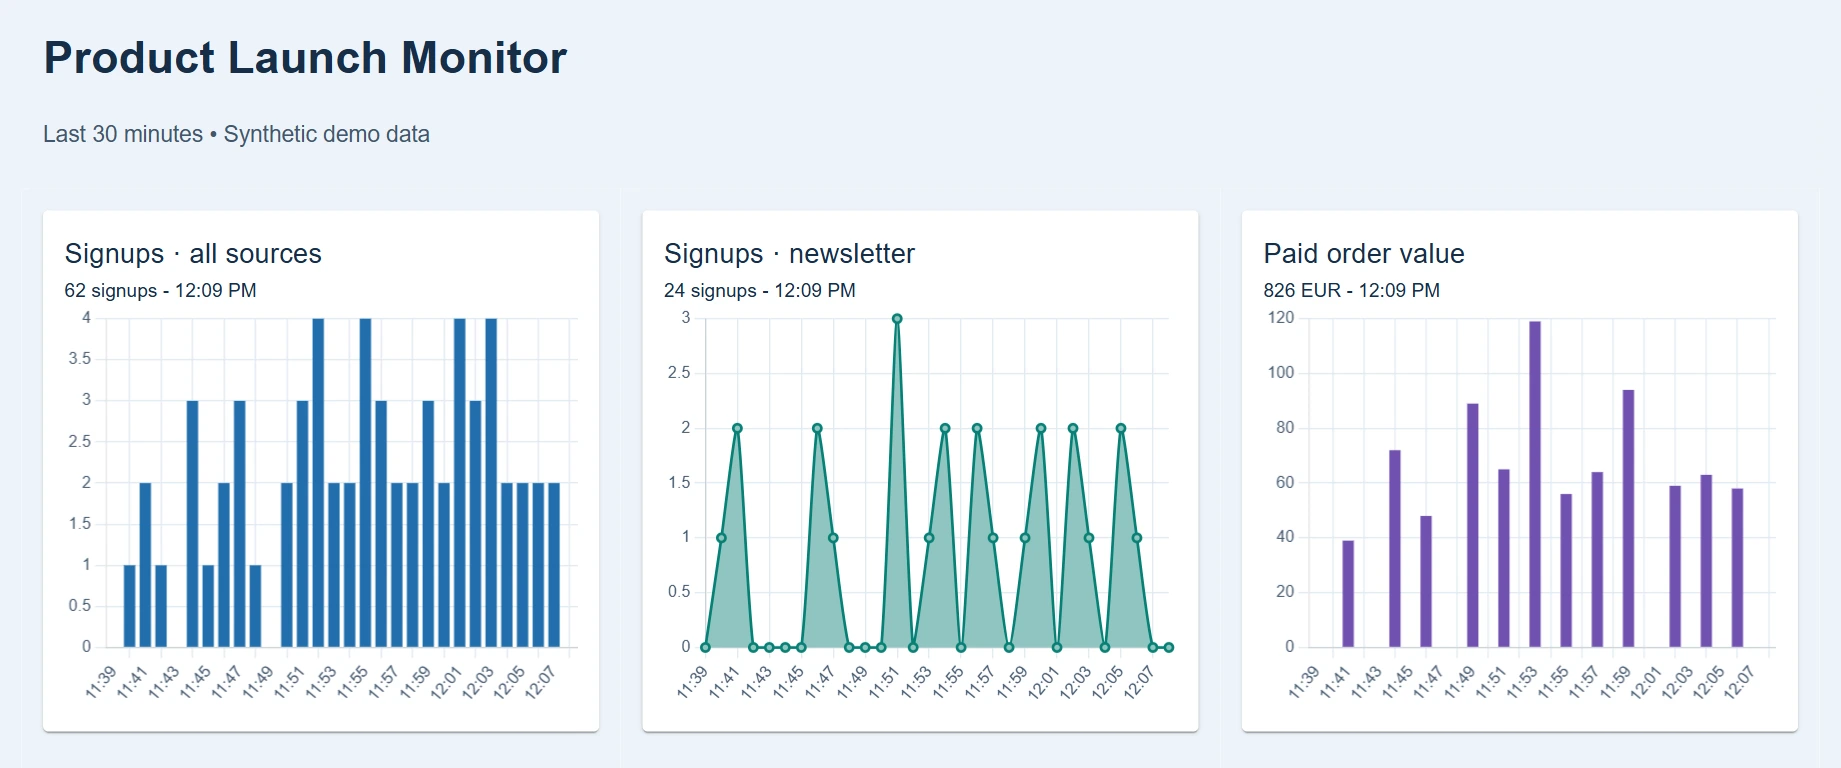
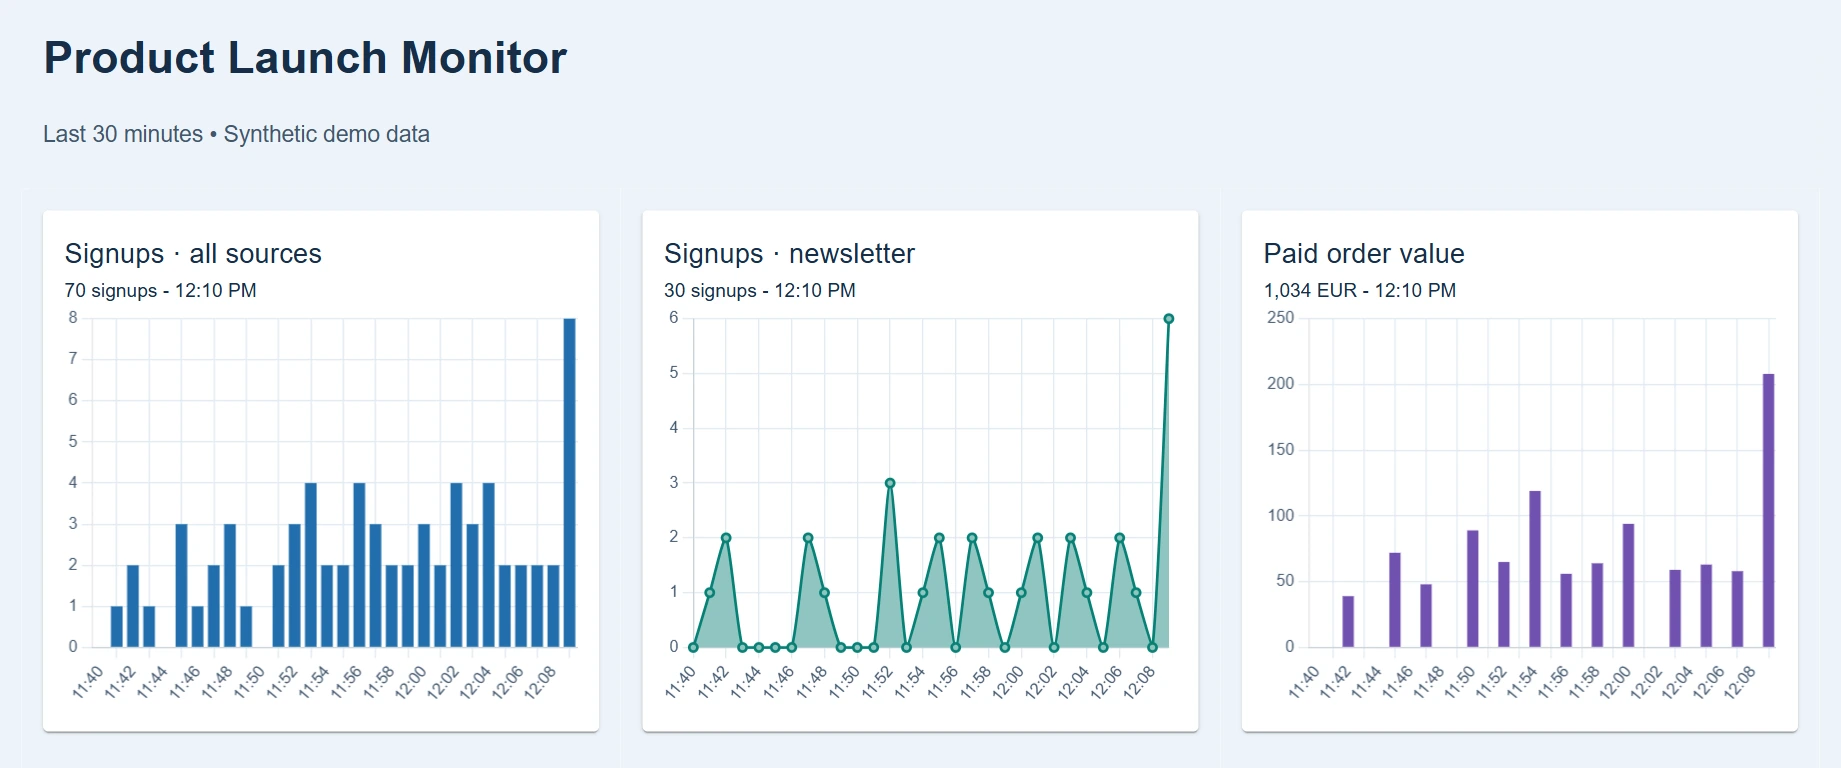
The signup count rose from 62 to 70, and the newsletter count went from 24 to 30. Paid order value increased from €826 to €1,034. Seeing the newsletter alongside overall signups gives the team an early read on the email response while keeping the wider launch in view.
Build your first real-time report
- Pick one event to track. Give it a consistent record type, such as `Signup`, and use a source such as `Newsletter` to identify where it came from. Include when it happened and a numeric value, such as `1` for a signup or the amount paid for an order.
- Get records into AutoROICalc. Start with a few recent test records. For ongoing reporting, use an integration or have your system send a record through the Records API when the event happens.
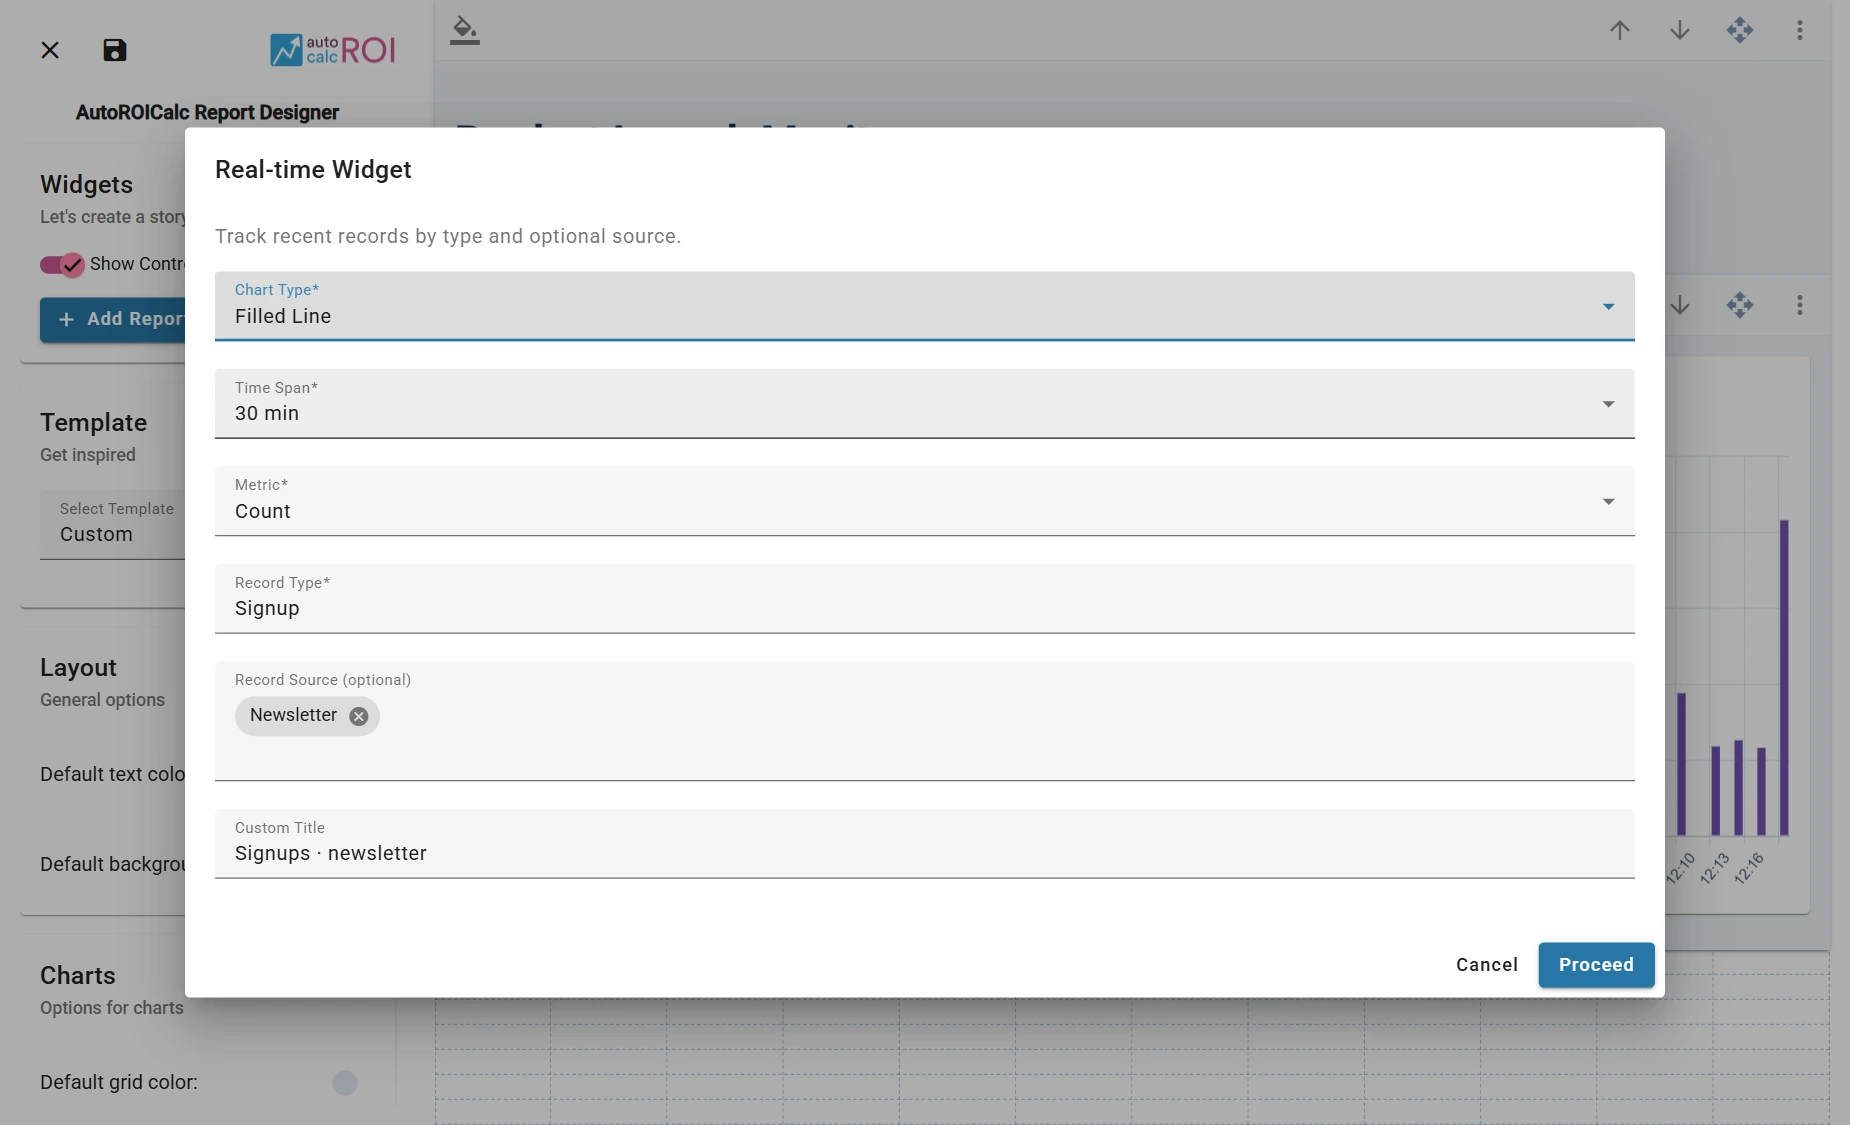
- Add a Real-time widget. Create a report with your record type as a report item, then enable the advanced layout and open Report Designer. Choose the record type, optionally select a source, and set a rolling time window. Use Count for individual events, Sum for amounts, or Average to chart averages over time.
The widget refreshes automatically while the report is visible. In this 30-minute view, it checks for new records every 15 seconds. If your source syncs on a schedule, its records appear after they arrive in AutoROICalc. Choose a short window for busy launch activity or give lower-volume events more time to show a pattern.
The same setup works for a support team watching new tickets from a particular channel or an operations team tracking jobs completed by a queue. Start with the event your team would act on today.
Frequently asked questions
What can I report on in real time?
You can track any activity you can capture as a timestamped record in AutoROICalc, such as signups, paid orders, support tickets, or completed jobs.
How do I set up a real-time report?
Add a few recent test records, then create a report that uses their record type. Enable the advanced layout, open Report Designer, and add a Real-time widget. Choose the record type, time window, and metric.
How quickly do new records appear?
The widget refreshes automatically while the report is visible. A 30-minute widget checks every 15 seconds, so new records can appear on the next refresh after AutoROICalc receives them.
Can I track a single source, such as a newsletter?
Yes. Choose a source in the widget settings to see only records from that source. For example, you can put newsletter signups next to signups from all sources.
What’s the difference between Count, Sum, and Average?
Count shows how many records arrived, such as the number of signups. Sum adds their numeric values, such as paid order amounts. Average charts the mean value in each time interval, such as the average order amount per minute.